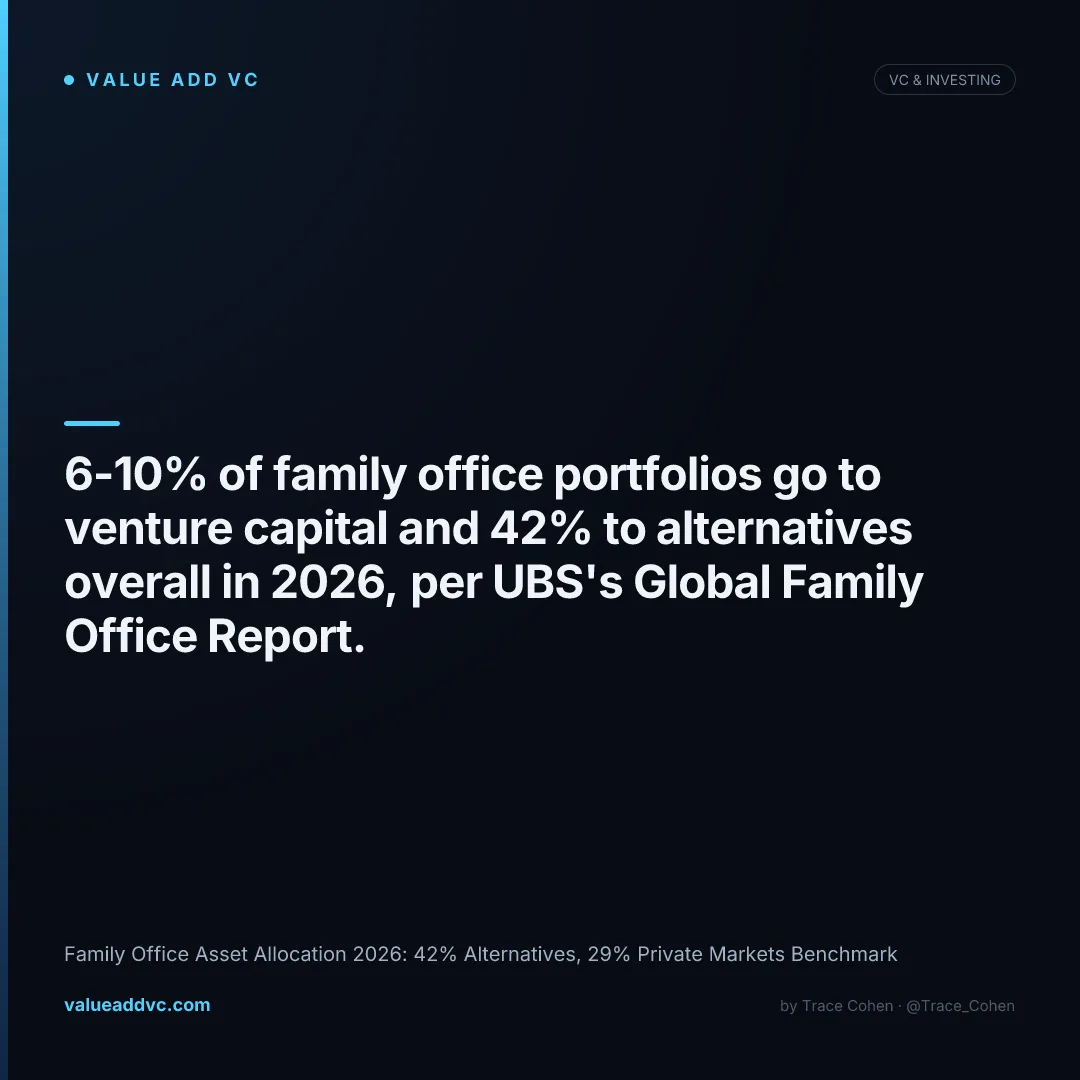
42% of the average family office portfolio now sits in alternative investments, and 29% specifically in private markets — private equity, venture capital, and private credit combined — according to UBS's 2026 Global Family Office Report of 307 offices averaging $1.3 billion in AUM. That's the short answer. The longer answer is that the mix inside "alternatives" is shifting fast, and the shift tells you more about where smart money expects returns to come from over the next five years than the headline number does.
The 2026 vintage is noticeably more defensive and more direct than 2021's. They're not chasing the same growth-at-any-price venture bets; they're rotating toward private credit, secondaries, and gold while quietly maintaining or even growing venture exposure through direct deals instead of blind-pool funds.
Figures blended from UBS's 2026 Global Family Office Report, Campden Wealth/RBC 2025 research, and Deloitte Private's family office AUM forecasts, as of July 2026.
Family Office Asset Allocation 2026: The Full Benchmark
The average family office in 2026 splits its portfolio roughly 41% developed-market equities and fixed income, 42% alternative investments, and the remainder in cash and other holdings, per UBS's survey of 307 offices with an average net worth of $2.7 billion. Within that alternatives sleeve, private markets — private equity, venture capital, and private credit combined — account for 29% of the average North American portfolio, per Campden Wealth's 2025 research with RBC Wealth Management, down slightly from 30% the prior year as offices reposition toward more liquid alternatives.
That reposition is the real story of 2026. Real estate allocations are pulling back from roughly 11% to 8% among offices making active changes, while private equity specifically is trending from 21% toward 18%. The capital isn't leaving alternatives — it's rotating into private credit, hedge funds, and secondaries, all of which offer shorter duration and more predictable cash flows than a 10-year VC fund lockup. Gold, long dismissed as a rounding error, has climbed from 2% to an expected 3% of portfolios as a geopolitical and dollar-weakness hedge, and 60% of offices surveyed by UBS said they plan portfolio shifts in the next 12 months.
Family Office Portfolio Allocation by Asset Class (2026)
| Asset Class | 2026 Allocation | 2025 Allocation | Direction |
|---|---|---|---|
| Developed market equities | ~27% | ~28% | Flat to slightly down |
| Fixed income | ~14% | ~15% | Flat |
| Private equity (buyout/growth) | 18-21% | 21% | Declining |
| Venture capital | 6-10% | 6-9% | Stable to up |
| Private credit | ~9% | ~7% | Rising fastest |
| Real estate | 8-11% | 11% | Declining |
| Hedge funds | ~6% | ~5% | Rising |
| Gold & commodities | 2-3% | ~2% | Rising |
| Cash & equivalents | ~6% | ~5% | Rising |
Figures are 2026 estimates blended from UBS's Global Family Office Report, Campden Wealth/RBC Wealth Management research, JPMorgan Private Bank's Global Family Office Report, and IQ-EQ's 2026 family office predictions. Ranges reflect variance across office size and region.
Why Venture Capital Allocation Is Holding Steady While PE Declines
Venture capital allocation among family offices sits at 6-10% of total portfolio assets for the typical office, rising to roughly 12% for the 50 largest family offices tracked by industry data, and family offices as a group now account for nearly one-third of all venture capital deployed globally. That's a remarkable share for a category of investor that, a decade ago, mostly accessed venture through a handful of fund-of-funds relationships. The shift is structural: more single family offices have built in-house deal teams capable of underwriting direct investments, which lets them skip the two-and-twenty fee stack and get closer to founders.
Buyout private equity is a different story — allocations are trending down from around 21% toward 18% globally as offices favor the shorter duration of private credit and secondaries over a decade-long PE lockup in a higher-rate environment. See our deeper look at how ultra-wealthy families are pouring capital into AI for the specific names and check sizes. You can see how this compares to institutional LP behavior on our VC Performance Dashboard.
Family Office Size and Regional Differences in Asset Allocation
Allocation strategy varies sharply by both AUM and geography. US family offices run alternatives-heavy at roughly 54% of the portfolio, well above the 42% global average, reflecting deeper access to VC and PE deal flow domestically. North America overall represents 52% of global family office geographic allocation for 2026, the largest regional weighting, followed by developed Europe and a growing Asia-Pacific slice as the region's family office count climbs toward 2,290 offices, roughly 29% of the global total.
Larger family offices — those north of $1 billion in AUM — consistently skew more direct and more concentrated in private markets, with the 50 largest tracked globally averaging 27% in private equity alone and 12% in venture, compared to the 21% and 6-8% typical of mid-sized offices in the $100-500 million range. Smaller offices, lacking in-house deal teams, still route most private market exposure through funds and co-investment vehicles rather than direct deals, which shows up as lower absolute allocation but similar risk exposure once leverage and vintage concentration are accounted for. For context on how family office structures differ from institutional LPs, see our breakdown of what a family office actually is and how it's structured.
What This Means for Founders and Fund Managers Raising From Family Offices
If you're a fund manager courting family office LPs in 2026, the allocation data tells you exactly what pitch lands: family offices aren't reducing venture exposure, but they are reducing tolerance for blind-pool commitments with no visibility into deployment — the same preference for direct, visible deployment that's shaping how sovereign vehicles like Abu Dhabi's MGX fund allocates its AI capital. Direct co-investment rights, shorter reserve cycles, and transparent reporting cadences matter more to this LP base than they did five years ago, because the family offices writing checks are increasingly building teams sophisticated enough to demand them.
For founders raising directly from family offices — which now represent close to a third of global VC dollars — expect more diligence rigor than a typical angel check but often faster decision speed than an institutional fund, since a single family office principal or CIO frequently holds final say without an investment committee. The tradeoff is that family offices are more sensitive to macro repositioning: the same 60% of UBS respondents planning portfolio shifts in the next 12 months means capital availability from this LP class can move faster than institutional allocators, in either direction. Track how VC fund performance benchmarks compare across LP types on our fund benchmarking tool.
Common Family Office Asset Allocation Mistakes
The biggest mistake is treating "42% alternatives" as a target rather than a starting point for a specific mandate. A single-family office with a 30-year time horizon and no near-term liquidity need can reasonably run 55-60% alternatives with a heavy VC and PE tilt, while a multi-family office serving clients who need annual distributions has no business chasing that same weighting — yet smaller offices regularly copy the allocation mix of a $5 billion peer without matching the liquidity profile underneath it. The UBS data reflects an average across very different mandates, which makes it a useful benchmark but a dangerous template to copy verbatim.
The second mistake is under-reserving for follow-on capital in venture and growth-equity commitments. Family offices that build a direct-deal book without setting aside 40-50% of the initial check size for pro-rata participation in later rounds routinely get diluted out of their best-performing positions by Series C, which defeats the entire purpose of going direct instead of through a fund. The third mistake, increasingly common in 2026, is overcorrecting into private credit purely for yield without underwriting the same credit risk a bank would — several family offices are now holding double-digit allocations to private credit vehicles they can't fully explain the underlying collateral or covenant structure of.
The fourth and most avoidable mistake is fee stacking: routing venture exposure through a fund-of-funds that charges its own 1-2% management fee on top of the underlying funds' 2-and-20, which can quietly erode net returns by 300-500 basis points a year. Family offices with in-house investment staff increasingly bypass this layer entirely by co-investing alongside institutional VCs directly, which is a large part of why direct deal volume from family offices has grown steadily even as overall VC fundraising has been choppier. Anyone benchmarking their own allocation against the 2026 numbers here should weight the venture and PE figures against their own fee structure, not just the headline percentage.
Bottom line: The 2026 family office asset allocation benchmark shows 42% in alternatives and 29% in private markets, but the headline number masks a real rotation — private equity and real estate allocations are shrinking while private credit, hedge funds, gold, and venture capital hold steady or grow. Family offices now supply nearly a third of global VC dollars, increasingly through direct deals rather than fund commitments, which makes them a fundamentally different LP to raise from than a pension or endowment. Anyone building a 2026 fundraising strategy around this capital pool needs to underwrite for shorter attention spans, more direct-deal competition, and a genuine appetite for private credit and secondaries eating into what used to be automatic PE and VC re-ups.
Latest from the Pulse
Get VC data most people never see
— free to subscribe
Trace's notes on venture, AI and startups, a few times a week. Join 5,000+ subscribers. No spam.