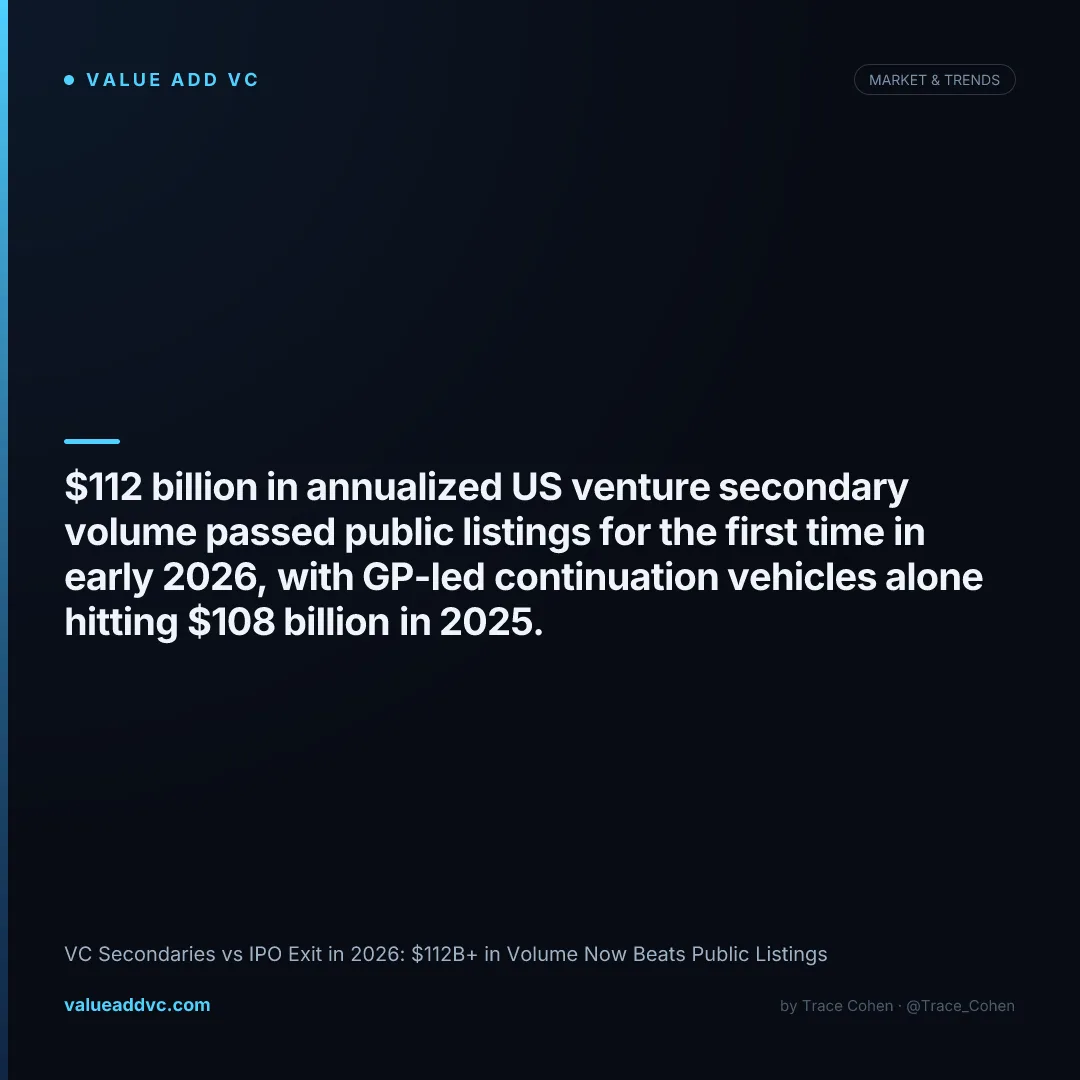
Annualized US venture secondary volume hit $112 billion in early 2026, surpassing public listings for the first time on record, while GP-led continuation vehicles alone reached $108 billion in 2025.
The traditional VC playbook — build, raise, IPO — has quietly broken down, and almost nobody outside the fund-of-funds world has fully priced it in. I've watched LPs in my own network get paid out of continuation vehicles they didn't even know existed five years ago, while portfolio companies that would have gone public in 2015 now stay private for a decade or more. Here's the data behind the shift, and what it means for anyone with capital sitting in a VC fund.
VC secondaries vs IPO exit in 2026: the numbers behind the flip
In the VC secondaries vs IPO exit comparison for 2026, secondaries have already won on volume: annualized US venture secondary transaction volume topped $112 billion in early 2026, exceeding the pace of public listings for the first time on record, per PitchBook and Coller Capital tracking. Total secondary market volume reached roughly $240 billion in 2025 and is projected to climb toward $250 billion in 2026, while total US IPO proceeds across every sector — not just venture-backed companies — came to just $44 billion from 202 offerings.
The exit-count gap is even starker than the dollar gap. PitchBook and NVCA data shows 995 acquisitions of US venture-backed companies in 2025 against only 62 public listings — a startup was roughly 16 times more likely to be sold than to IPO. Track how this plays out for specific portfolio companies on the Tech IPO dashboard and see fund-level exit performance on the VC & PE Performance dashboard.
Secondaries vs IPO exits: side-by-side comparison
Here's how the two exit paths actually compare across the variables that matter to GPs and LPs.
| Variable | Secondaries | IPO |
|---|---|---|
| 2025 volume | ~$240B total, $108B-$115B GP-led | $44B (202 IPOs, all sectors) |
| 2025 VC-backed exit count | 995 acquisitions/secondary trades | 62 public listings |
| Time to close | 3-6 months typical | 12-24+ months (S-1 to trading) |
| Pricing | Often 10-30% discount to last round | Set by underwriters at roadshow demand |
| Regulatory burden | Light — private transaction, no SEC filing | Heavy — S-1, SEC review, quarterly reporting |
| GP/founder control | GP retains control via continuation vehicle | Cedes control to public shareholders/board |
| Concentration risk | Top 20 startups = 86.4% of Q4 2025 volume | 3 mega-IPOs (SpaceX, OpenAI, Anthropic) could exceed $100B combined in 2026 |
| Avg. deal size 2025 | ~$900M average continuation vehicle | ~$218M average IPO raise ($44B / 202) |
Figures are 2025-2026 estimates blended from PitchBook, NVCA, Renaissance Capital, Coller Capital, and Dechert LLP secondaries research. GP-led CV volume figures vary slightly by tracker ($108B-$115B) due to differing definitions of what counts as GP-led.
Why GP-led continuation vehicles are driving the VC secondaries vs IPO exit shift
The single biggest driver of the secondaries boom is the GP-led continuation vehicle, where a fund manager rolls one or more prized portfolio companies into a new vehicle so existing LPs can cash out while new investors buy in at a fresh mark. GP-led CV volume hit $108-115 billion in 2025, up more than 50% from $77 billion in 2024, and twenty-nine individual GP-led transactions exceeded $1 billion last year, up from 21 in 2024. GP-led deals now make up roughly 48% of the entire $240 billion secondary market.
Why has this become the default liquidity mechanism instead of the IPO? Founders are staying private longer because there's simply less pressure to go public — growth capital is abundant, and companies like SpaceX and OpenAI have raised tens of billions in private rounds without ever filing an S-1. That leaves LPs who need distributions (pensions, endowments, funds nearing their end-of-life) with two choices: wait a decade for an IPO that may never come, or sell into a continuation vehicle at a negotiated discount today. Most institutional LPs are choosing the latter, which is exactly how you end up with the pile-up we detailed in our analysis of the 200+ unicorns still waiting to list.
The 2026 mega-IPO wave and what it means for the secondaries vs IPO trend
There's a real counter-trend brewing: if SpaceX, OpenAI, and Anthropic all complete public listings in 2026, PitchBook estimates they could generate more than $100 billion in combined proceeds — more exit value than every US VC-backed IPO since 2000 combined. SpaceX is reportedly targeting a roughly $1.5 trillion valuation for a mid-2026 debut, OpenAI was valued at $840 billion in a $110 billion round closed in February 2026, and Anthropic closed its Series G that same month at a $380 billion valuation. Renaissance Capital already tracked 34 IPOs raising $9.9 billion in Q1 2026 alone, suggesting the public window is reopening.
But even a historic mega-IPO year wouldn't flip the underlying pattern back to public-market dominance — it would just be three enormous, highly concentrated outcomes sitting on top of a private market that's still doing 16 times more deal volume by count. And the secondaries market has its own concentration problem worth flagging: the top 20 startups drove 86.4% of all secondary trading value in Q4 2025, with the top five names alone accounting for 55.6%. Both markets, in other words, are increasingly bets on a small number of trophy companies rather than a broad, diversified exit environment.
2025 Exit Volume: Secondary Market vs Total US IPO Proceeds ($B)
Source: PitchBook, Coller Capital secondary tracking; Renaissance Capital IPO data, 2025-2026.
How this compares to the 2021 IPO boom and the 2022-2023 exit drought
Context matters here. In 2021, venture-backed companies went public at a record clip — hundreds of listings and SPAC mergers pushed exit activity to an all-time high, and secondaries were still a niche, somewhat stigmatized corner of the market that signaled a fund was struggling for liquidity rather than actively managing its portfolio. That flipped hard in 2022-2023, when rate hikes closed the IPO window almost entirely and annual VC-backed IPO counts fell into the single digits at some points, forcing LPs to sit on paper marks for years with no distributions. Secondaries stepped into that vacuum as the only reliable liquidity mechanism, and once GPs and LPs got comfortable running continuation vehicles at scale, the infrastructure — specialist buyers, standardized legal templates, dedicated secondaries funds from firms like Coller Capital, Lexington Partners, and HarbourVest — never went away even as the IPO window partially reopened in 2025. That fundraising appetite is exactly why CVC's sixth secondaries vehicle closed at $10 billion — the largest dedicated secondaries fund close since 2019.
That's the real structural story: this isn't a temporary IPO-drought workaround, it's a permanent new layer of the private markets. Continuation vehicles are projected to account for 30-40% of all private equity exits by 2027, according to industry forecasts from GCM Grosvenor, up from a low-single-digit share just five years ago. Even in a year with a historic mega-IPO wave, the secondaries infrastructure built during the drought years keeps growing rather than shrinking back to its pre-2022 niche status.
The mechanics and risks of a continuation vehicle sale
A typical GP-led continuation vehicle works like this: the GP identifies one or two trophy assets still held in an aging fund, forms a new special-purpose vehicle, and runs a process where a lead secondaries buyer (often a dedicated secondaries fund) sets a price for the existing LP interests. Existing LPs then get a binary choice — sell at that price and take the cash, or roll their interest into the new vehicle and stay exposed to further upside. In practice, most LPs take the cash, since the entire point of the transaction for a pension fund or endowment nearing a rebalancing deadline is realized liquidity, not continued exposure to a single concentrated bet.
The conflict-of-interest risk is real and worth naming directly: the GP running the sale process is also the party deciding which assets go into the vehicle and negotiating the price on behalf of LPs who may not have the resources to independently verify a fair valuation. That's why institutional allocators increasingly demand an independent fairness opinion and a formal LP advisory committee sign-off before approving a continuation vehicle, and why 71% of institutional LPs now require third-party valuation review on at least an annual basis across their private fund relationships, per Altss's 2026 LP survey.
For a fund manager, the appeal is straightforward: a continuation vehicle lets a GP keep managing (and collecting fees on) a winning asset well past a fund's contractual 10-year life, rather than being forced into a fire-sale or a rushed IPO on a timeline dictated by a fund's wind-down clock. That's a meaningful change in how fund economics work, and it's part of why management fee structures and reserve strategy are getting more scrutiny from LPs than at any point in the last decade.
What the VC secondaries vs IPO exit trend means for LPs and founders in 2026
For LPs, the practical upshot is that distributions are increasingly going to arrive through a continuation vehicle sale, not a public listing — and LPs should expect to see that transaction priced at a 10-30% discount to the company's last private mark, since buyers demand a premium for taking on illiquidity risk that used to sit with the original fund. LPs evaluating a fund's quarterly reports should specifically ask whether reported TVPI includes marks on positions still held inside a GP-led CV, since that can inflate paper returns relative to actual realized DPI.
For founders, the calculus has shifted too: staying private for 10-15 years is now the norm rather than the exception, and building a cap table that can survive multiple secondary rounds — with clean ROFR provisions and transfer restrictions — matters as much as the initial term sheet. Track how VC funds structure these outcomes on the SPV dashboard, and see how fund performance benchmarks are shifting on the VC & PE Performance dashboard.
The winner in this comparison, at least for 2026, is clear on volume and deal count: secondaries. $112 billion in annualized volume against $44 billion in total IPO proceeds isn't close, and 995 acquisitions against 62 IPOs isn't close either. The IPO market isn't dead — a SpaceX, OpenAI, or Anthropic listing would be the single largest venture-backed exit in history — but as a structural liquidity mechanism for the broad base of venture portfolios, secondaries have already taken over.
The scoreboard on VC secondaries vs IPO exit in 2026:
Secondaries: $112B+ annualized volume and 995 acquisitions. IPOs: $44B in proceeds and 62 listings. Secondaries win on every volume metric — IPOs still win on single-deal size.
Track fund-level exit performance on the VC & PE Performance dashboard and upcoming listings on the Tech IPO dashboard at Value Add VC. Originally published in the Trace Cohen newsletter.
Latest from the Pulse
Get VC data most people never see
— 100% free
Weekly benchmarks, valuations, and fund data. Join 5,000+ investors. No spam.