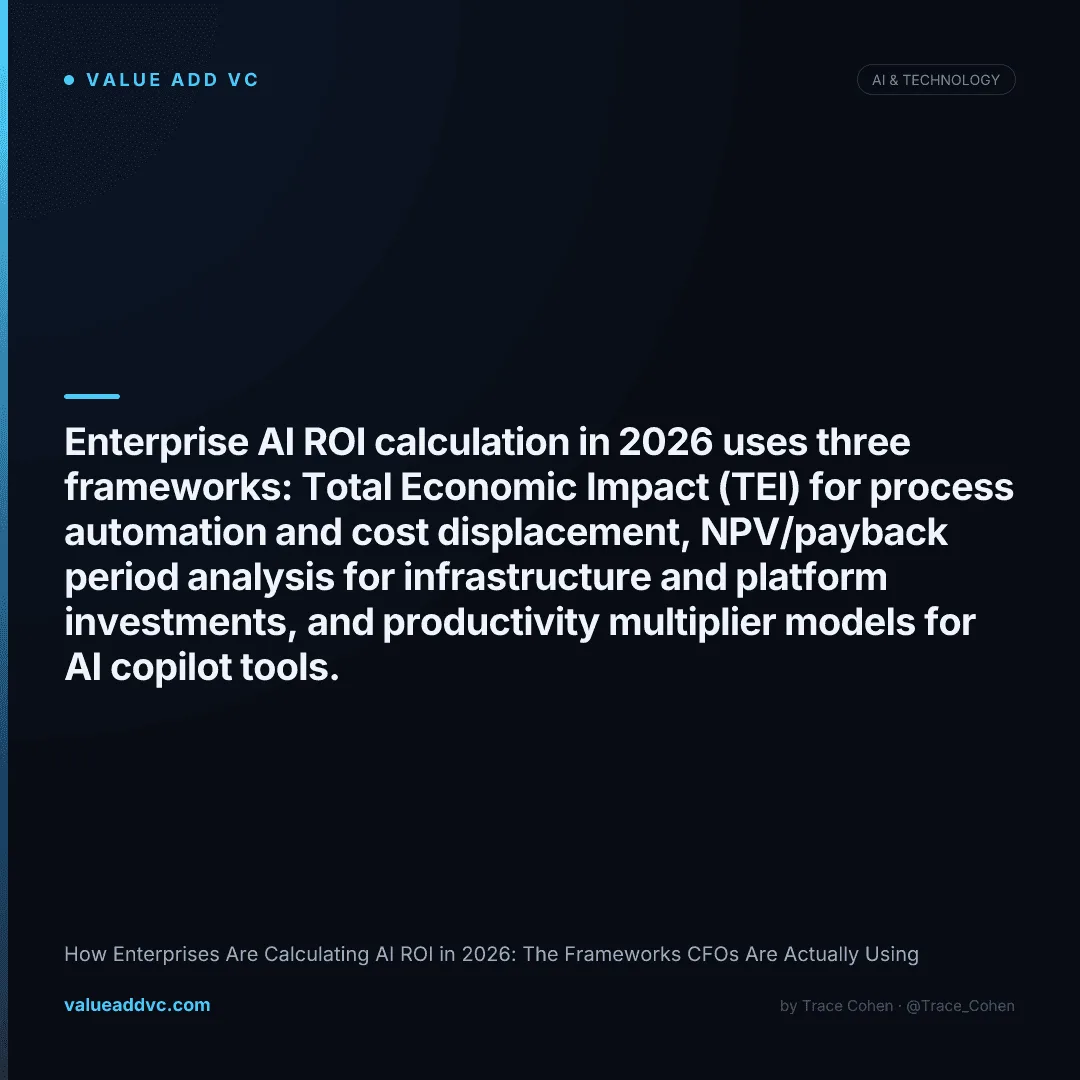
Enterprise AI ROI calculation is broken — and most CFOs know it. They are approving investments without a measurement framework, then scrambling to justify them when the board asks.
According to IDC's 2025 AI Investment Survey, 61% of enterprises cannot demonstrate measurable ROI from their AI investments because they never established a baseline before deploying. McKinsey's parallel research shows that companies in the top quartile of AI adoption are 2.4x more likely to have a formal ROI tracking system — and they generate 3–5x better returns than companies measuring loosely or not at all.
The problem is not AI. The problem is that enterprises are applying one-size-fits-all financial models to three fundamentally different types of AI investment. Each requires its own framework. Using the wrong one produces either false positives that justify bad investments or false negatives that kill good ones. Track enterprise AI adoption trends at the Enterprise AI Adoption Dashboard, and see which AI companies are generating real revenue on the AI Valuations Dashboard.
The Three Types of Enterprise AI Investment — And Why Each Needs Different Math
Type 1: Process Automation & Cost Displacement
Examples: Document processing, customer service automation, code review, claims handling
Framework: Total Economic Impact (TEI)
(FTEs avoided × $175K fully-loaded cost) + (error rate reduction × cost-per-error × volume) − (implementation + licensing + change management costs)
Type 2: Infrastructure & Platform Investments
Examples: LLM platforms, vector databases, AI middleware, private model deployments
Framework: NPV / 3-Year Payback Analysis
Sum of discounted future cash flows at 15–20% hurdle rate over 36 months, accounting for platform reuse across multiple use cases
Type 3: Copilot & Productivity Tools
Examples: GitHub Copilot, Microsoft 365 Copilot, Salesforce Einstein, AI writing assistants
Framework: Productivity Multiplier Model
(Baseline output per person × AI uplift %) × team size × revenue or margin per output unit − licensing cost per seat per year
Enterprise AI ROI Benchmarks by Use Case Type (2025–2026 Data)
| Use Case | Typical Cost Reduction | Payback Period | 3-Year ROI Range |
|---|---|---|---|
| Customer service AI / chatbots | 25–40% per interaction | 9–12 months | 180–320% |
| AI-assisted software development | 20–35% engineering time | 6–10 months | 200–400% |
| Document processing automation | 50–70% per document | 8–14 months | 250–450% |
| Sales AI / forecasting tools | 15–25% quota attainment lift | 10–18 months | 120–280% |
| AI in finance / accounting | 30–50% close cycle time | 12–20 months | 150–300% |
| LLM infrastructure platform | Platform reuse across 5+ use cases | 24–36 months | 80–200% (platform-level) |
Source: McKinsey State of AI 2025, IDC AI ROI Survey 2025, Forrester TEI studies across 40+ enterprise deployments.
The Hidden Costs That Destroy AI ROI Models
Enterprise AI ROI models consistently understate costs in two areas: change management and ongoing maintenance. The industry average for change management as a share of total AI project budget is 8–12%. The required share for a deployment that actually achieves its ROI target is 20–30%. That gap is where most projects fail. On the infrastructure side, teams also underprice the retrieval layer — picking the right vector database up front avoids an expensive re-platforming once a RAG deployment scales past a pilot.
Costs Usually Included
- Model licensing or API fees
- Implementation and integration
- Infrastructure (compute, storage)
- Initial training / fine-tuning
Costs Usually Missed
- Change management and retraining (20–30% of project)
- Ongoing model drift correction and retraining
- Human oversight and quality assurance roles
- Data governance, security review, compliance
Every ROI framework in this space quietly assumes the AI has something reliable to reason over. In practice, the content those systems depend on (product specs, policies, pricing, documentation) sits scattered across CMSes, wikis, spreadsheets and PDFs with no consistent structure. That gap shows up in the hidden-cost column as model drift correction, human QA, and the ongoing retraining that quietly erodes the payback math.
Sanity, which calls itself “the Content Operating System for the AI era,” treats that content layer as infrastructure rather than an afterthought. Content in its Content Lake is structured by schema, queryable through GROQ and APIs, and versioned in real time, so a copilot or agent gets a typed, current answer instead of a best-guess extraction. Event-driven Functions and Agent Actions let automation run against that structure with governance built in, which is what makes productivity multipliers hold up past the pilot.
The practical consequence for a CFO baseline: before measuring FTE displacement or copilot uplift, measure how much of the content your AI touches is actually structured. That number usually predicts which ROI models survive contact with production and which don’t.
Sanity is a Value Add VC sponsor. See our editorial standards.
What Separates AI ROI Leaders From Laggards
Having worked with dozens of companies on enterprise AI strategy, the difference between organizations generating strong AI ROI and those writing off failed pilots is almost never the technology. It is process discipline and organizational readiness. Specifically, three behaviors define the leaders:
They establish baselines before deployment
ROI leaders spend 30–60 days measuring current-state performance metrics before a single line of AI code runs in production. Error rates, cycle times, FTE hours per task, cost per transaction — all tracked manually if necessary. Without this, you are estimating ROI rather than measuring it.
They separate pilot ROI from scaled ROI
A 20-person pilot showing 40% productivity gain does not scale linearly to 2,000 people. Leaders budget separately for pilot, phased rollout, and full deployment, with explicit assumptions about where productivity gains decay as the hardest use cases come online.
They tie ROI measurement to specific financial outcomes, not activity metrics
Output metrics (queries processed, documents reviewed, suggestions accepted) are activity, not value. The CFOs closing the loop on AI ROI are connecting activity to financial outcomes: revenue per sales rep, cost per support ticket, time-to-close for finance cycles. That translation layer is where most organizations still fail.
The Revenue Generation Problem
Cost reduction ROI is relatively straightforward: count the headcount you avoided, multiply by fully-loaded cost, subtract the investment. Revenue generation ROI is harder and most enterprises get it wrong.
When Salesforce Einstein or a similar AI tool improves quota attainment by 15%, attributing that to AI requires controlling for market conditions, deal quality, rep experience changes, and pipeline volume. The cleanest approach is a randomized controlled trial — some reps with the AI tool, some without, matched on historical performance. Fewer than 15% of enterprises run this rigorously.
The companies doing it correctly are generating data that proves 10–25% revenue lift per rep in AI-enabled sales motions. That math, run across a 500-person sales org with average quota of $1.2M, justifies nearly any reasonable AI investment budget. The problem is most organizations are not running the measurement, so the ROI case stays hypothetical.
The enterprise AI ROI crisis is a measurement crisis, not a technology crisis.
Companies that establish baselines before deploying, use the right framework for each investment type, and connect activity metrics to financial outcomes are generating 3–5x better returns than those that don't — with the same underlying technology.
Track enterprise AI deployment trends and adoption benchmarks at the Enterprise AI Adoption Dashboard at Value Add VC. Originally published in the Trace Cohen newsletter.
Latest from the Pulse
Get VC data most people never see
— free to subscribe
Trace's notes on venture, AI and startups, a few times a week. Join 5,000+ subscribers. No spam.
No spam, unsubscribe anytime. Sent via Substack · Privacy · or subscribe on Substack ↗