
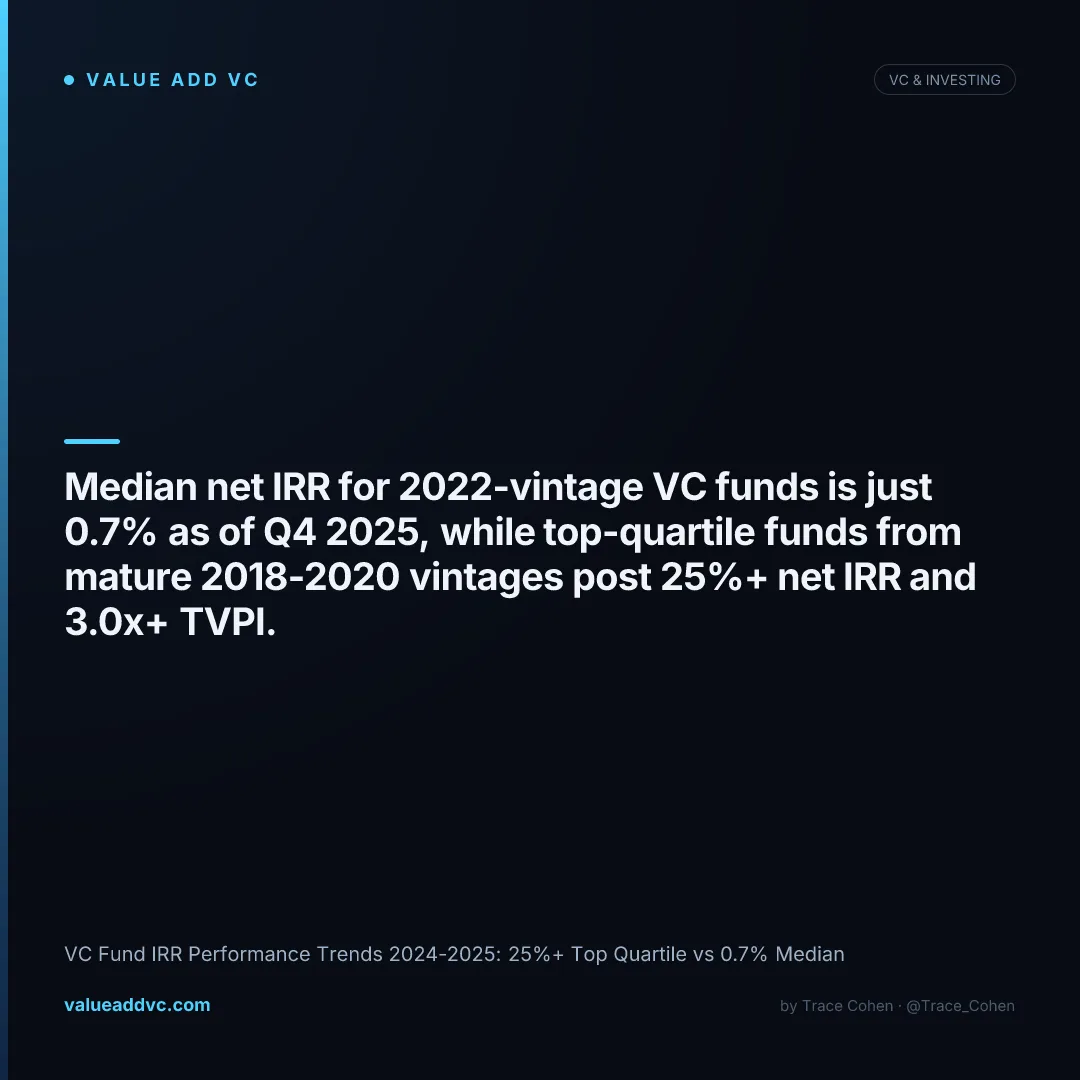
Median net IRR for 2022-vintage VC funds is 0.7% as of Q4 2025, while top-quartile funds from mature vintages post 25%+ net IRR — a roughly 24-point gap. That's the short answer. The longer answer is more interesting.
Every LP allocation memo I read this year says some version of "venture returns are bifurcating," but the Carta and Cambridge Associates vintage-year data now shows exactly how wide that split has gotten. It's not just that the median VC fund is mediocre — it's that the distance between median and top-quartile has stretched further than at any point since these benchmarks started getting tracked at this level of granularity, and recent vintages (2021-2022) are stuck near breakeven while older, mature vintages show the top-heavy power-law shape venture has always had, just more extreme.
Venture Capital IRR Performance Trends 2024-2025: What the Data Shows
Venture capital IRR performance trends for 2024-2025 show a market still dominated by early-stage vintages with almost no realized data, sitting on top of a widening gap in mature-vintage performance. 2024-vintage funds are holding 53% of committed capital as unspent dry powder, and 2025-vintage funds are holding 72%, per Carta's Q4 2025 report — meaning there's essentially no usable IRR signal yet for the two most recent vintage years. The real story is in 2018-2022: mature funds (2018-2020) show top-quartile net IRR of 25%+ and TVPI of 3.0x+, while the still-maturing 2021 and 2022 vintages post median net IRRs of just 1.4% and 0.7% respectively, both barely off the bottom of their J-curves.
TVPI by Vintage Year: The Top-Quartile Gap Keeps Widening
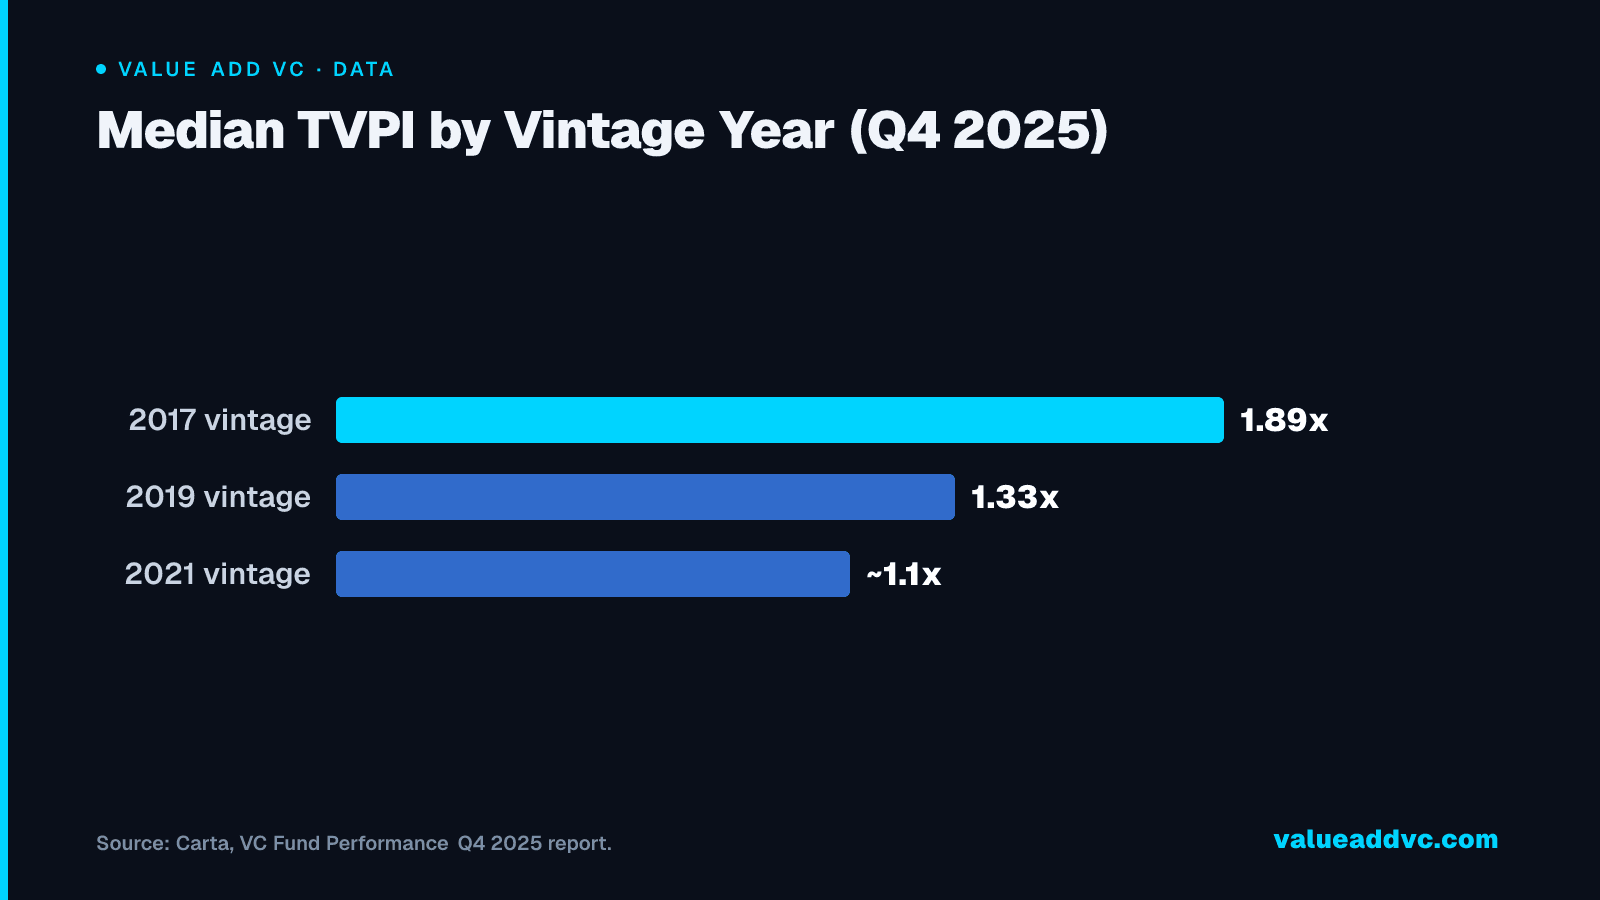
Look at TVPI (total value to paid-in capital) across mature vintages and the top-heavy shape of venture returns gets stark. For the 2017 vintage — nine years mature and with plenty of realized exits — median TVPI sits at 1.89x, top-quartile is 2.53x, and top-decile is 4.08x. For the 2019 vintage, median TVPI is 1.33x, the 75th percentile is 1.9x, and the 90th percentile is 3.01x. Critically, the gap between the 75th and 90th percentiles is now larger than the gap between the 25th percentile and the median in both vintages — a small number of funds are pulling dramatically ahead of an increasingly compressed middle, which is exactly the "power law within a power law" dynamic that's showing up across every LP benchmark this cycle.
Median TVPI by Vintage Year (Q4 2025)
Older, more mature vintages show meaningfully higher median TVPI as J-curve effects fade and distributions accumulate — but even the 2017 vintage's 1.89x median trails its own top-quartile mark of 2.53x by a wide margin.
Carta, VC Fund Performance Q4 2025 report.
Data
| Item | Value |
|---|---|
| 2017 vintage | 1.89x |
| 2019 vintage | 1.33x |
| 2021 vintage | ~1.1x |
IRR and TVPI Benchmarks by Vintage Year and Percentile
The table below blends Carta's Q4 2025 vintage-year data with Cambridge Associates' benchmark commentary to show how net IRR, TVPI, and DPI move across percentiles as a fund matures. Mature vintages (2017-2020) show the classic power-law spread; recent vintages (2021-2022) are still compressed near zero while they work through markdowns from the 2021 valuation peak.
| Vintage year | Median net IRR | Top-quartile net IRR | Median TVPI | Top-decile TVPI |
|---|---|---|---|---|
| 2017 | ~12-14% | 25%+ | 1.89x | 4.08x |
| 2018 | ~11-13% | 25%+ | ~1.6x | ~3.4x |
| 2019 | ~9-11% | ~20%+ | 1.33x | 3.01x (90th pct.) |
| 2020 | ~6-8% | ~18-20% | ~1.25x | ~2.6x |
| 2021 | 1.4% | 14.8% (top decile) | ~1.1x | ~1.6x (est.) |
| 2022 | 0.7% | 19% (top decile) | ~1.0x | ~1.5x (est.) |
| 2024 | Not meaningful | Not meaningful | ~1.0x | 53% dry powder remaining |
| 2025 | Not meaningful | Not meaningful | ~1.0x | 72% dry powder remaining |
Figures are Q4 2025 estimates blended from Carta's VC Fund Performance Q4 2025 report, Cambridge Associates' US PE/VC Benchmark Commentary (H1 2025), and Value Add VC's own vintage-year tracking. Mid-decade vintage IRR figures (2018-2020) are interpolated from Cambridge Associates percentile bands where Carta doesn't report a standalone figure; treat as directional, not exact.
Why 2021 and 2022 Vintage Funds Are Still Stuck Near Zero
The 2021 vintage deployed capital at the absolute peak of the 2020-2021 valuation bubble, and the bill is still being paid: median TVPI sits around 1.1x after 30-50% markdowns from peak marks, and only about a third of 2021-vintage funds have recorded any distributions at all. The 2022 vintage is outperforming 2021 by 20-30% at the same stage of maturity — a real, measurable improvement that reflects lower entry valuations — but its median net IRR of 0.7% shows it's still working through the same J-curve mechanics: management fees and early markdowns dominate the first 2-3 years of any fund's life before markups and exits start pulling the curve back up.
2021 vs 2022 Vintage: Median Net IRR and Top-Decile IRR
Carta, VC Fund Performance Q4 2025 report.
Data
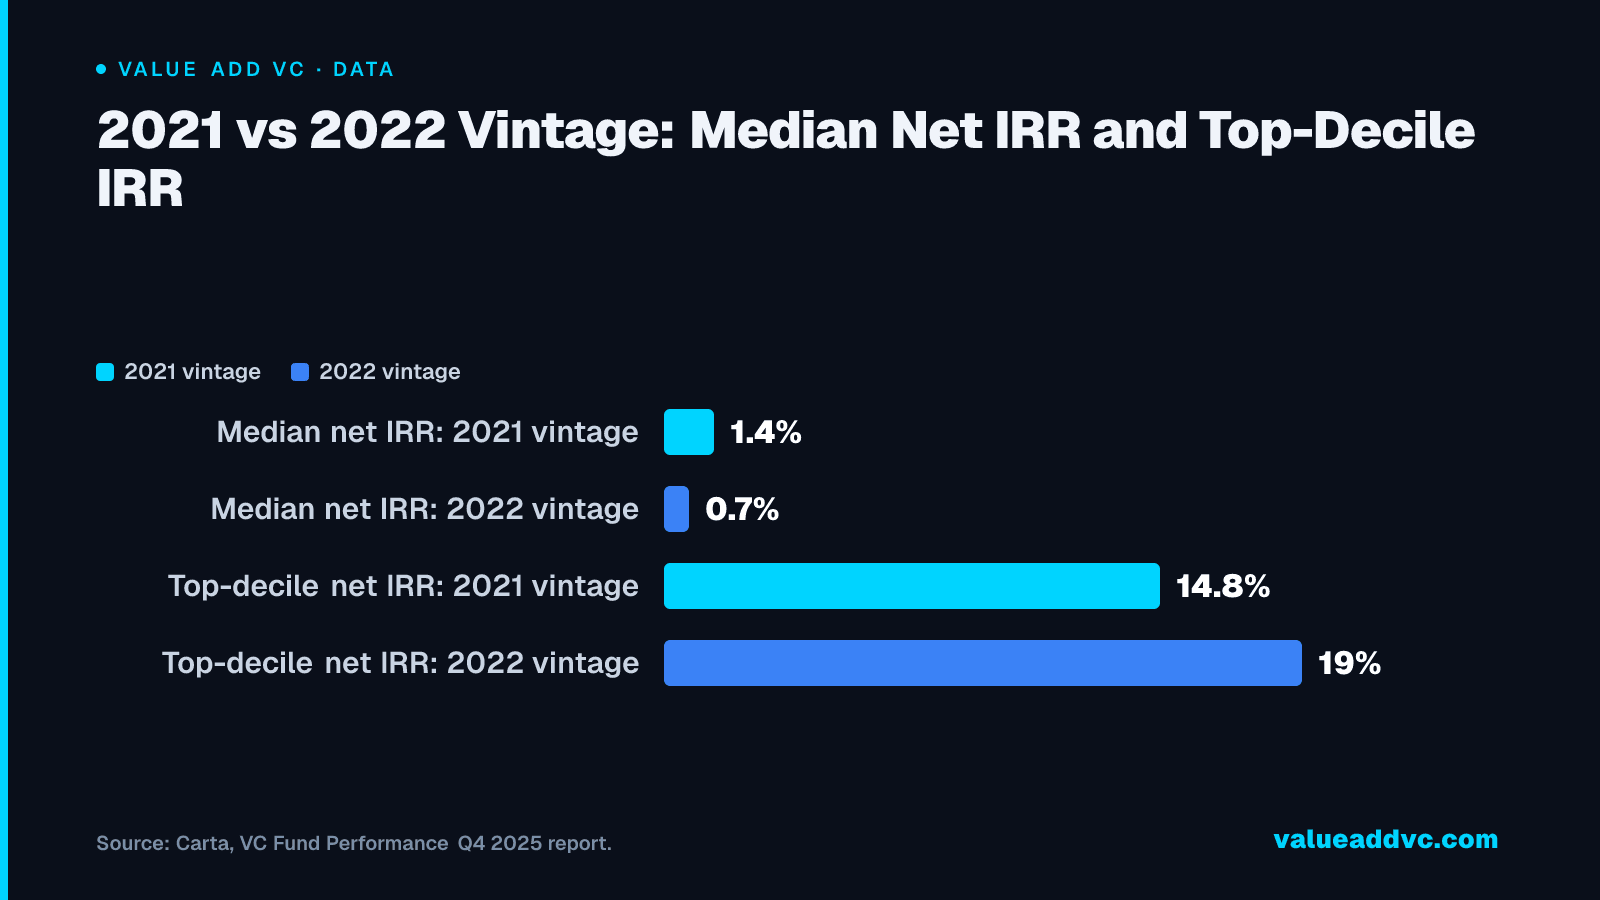
Notice the reversal: 2022's median IRR is lower than 2021's, but its top-decile IRR is higher — 19% versus 14.8%. That's the bifurcation showing up inside a single vintage year, not just across vintages. The best 2022 funds are already pulling ahead of the best 2021 funds, even though the typical fund from each vintage is roughly tied at breakeven. That divergence is worth sitting with, because it means the traditional shortcut of using a vintage year as a rough proxy for expected fund quality is getting less reliable — the manager you picked now matters more than the year you picked them in, at every stage of a fund's life, not just at exit.
DPI Is the Metric That Separates Real Performance From Paper Markups
IRR and TVPI both include unrealized, mark-to-model valuations, which is exactly why DPI (distributions to paid-in capital) — cash actually returned to LPs — has become the more scrutinized metric in every allocator conversation I've had this year. Only about a third of 2021-vintage funds have recorded any DPI at all, four years into the fund's life, and 2022-vintage funds are even further behind that curve. Compare that to mature 2018-2020 vintages, where top-quartile funds are approaching or exceeding 1.0x DPI as exits and secondary sales finally convert paper gains into distributed cash. The lag isn't unusual on its own — venture funds typically don't return meaningful DPI until year 6-8 — but it means every IRR and TVPI figure quoted for a 2021-2022 vintage fund today is still almost entirely a paper number, one more markdown or markup away from moving materially in either direction. It's also the same reason GPs who took carry on early wins can end up owing it back if the rest of the portfolio marks down later.
That distinction matters even more given how muted the 2026 exit environment has been for venture-backed companies relative to the record fundraising years of 2020-2021: fewer IPOs and strategic acquisitions mean fewer opportunities for 2021-2022 vintage funds to convert markups into DPI on the timeline LPs are used to. Funds that do post early DPI in a slow exit market — through secondaries, continuation vehicles, or genuine M&A — are sending a much stronger signal about underlying portfolio quality than a fund whose entire return story still lives in unrealized TVPI.
Is the Top Quartile Getting Harder to Reach? What This Means for LPs and GPs
For LPs, the practical takeaway from these venture capital IRR performance trends is that manager selection now matters more than asset-class exposure: the difference between a top-decile and median 2019-vintage fund is roughly 1.7x in TVPI (3.01x versus 1.33x), which dwarfs anything a passive index-style allocation to "venture as an asset class" could deliver. For emerging GPs raising a Fund I or II right now, the bar to prove top-quartile potential is objectively higher than it was a decade ago, since LPs increasingly have this exact percentile data at their fingertips when making allocation decisions. I track this same dynamic for the funds and LPs I work with through our VC fund performance dashboard and our broader VC and PE benchmarking tool, both of which track these percentile bands by vintage year as new data lands each quarter.
The other implication is timing-specific: anyone benchmarking a 2021 or 2022-vintage fund against historical top-quartile marks needs to adjust expectations for where those vintages sit in their own J-curve, not compare a 4-year-old fund's IRR directly against a 9-year-old fund's IRR. A 2022-vintage fund sitting at 0.7% median IRR isn't necessarily underperforming — it's on a similar early-stage trajectory to where the 2017 and 2018 vintages sat at the same age, before those vintages eventually produced the 25%+ top-quartile outcomes we see today. The real risk signal isn't a low IRR in year 3-4; it's a fund still showing sub-1.0x TVPI by year 6-7, which is the point at which mature-vintage data shows top-quartile funds have already pulled decisively ahead.
There's also a practical due-diligence lesson buried in this data for LPs sizing up an unfamiliar Fund II or Fund III pitch: ask for the fund's percentile ranking within its own vintage year, not just its headline IRR or TVPI in isolation. A 2019-vintage fund quoting a 1.5x TVPI sounds respectable until you learn the same vintage's top quartile sits at roughly 2.0x-2.5x and top decile at 3.0x — meaning that "respectable" fund is actually tracking closer to median than to the outcomes that make venture worth the illiquidity and fee drag in the first place. Vintage-relative benchmarking, not absolute return thresholds, is the only honest way to read these numbers at this point in the cycle.
The Bottom Line
VC fund IRR performance trends through Q4 2025 confirm the top quartile is getting harder to reach in relative terms: mature top-quartile funds post 25%+ net IRR and 3.0x+ TVPI, while the median 2022-vintage fund sits at just 0.7% net IRR and roughly 1.0x TVPI. The spread between the 75th and 90th percentile of fund performance now exceeds the spread between the median and 25th percentile in multiple vintages — a small number of funds are compounding an advantage that's structurally difficult for the average fund to close. For LPs, that means manager selection is doing more of the return-generation work than ever; for GPs, it means the data bar for proving top-quartile potential keeps rising every time a new vintage-year benchmark report comes out.
Latest from the Pulse
Get VC data most people never see
— free to subscribe
Trace's notes on venture, AI and startups, a few times a week. Join 5,000+ subscribers. No spam.
No spam, unsubscribe anytime. Sent via Substack · Privacy · or subscribe on Substack ↗