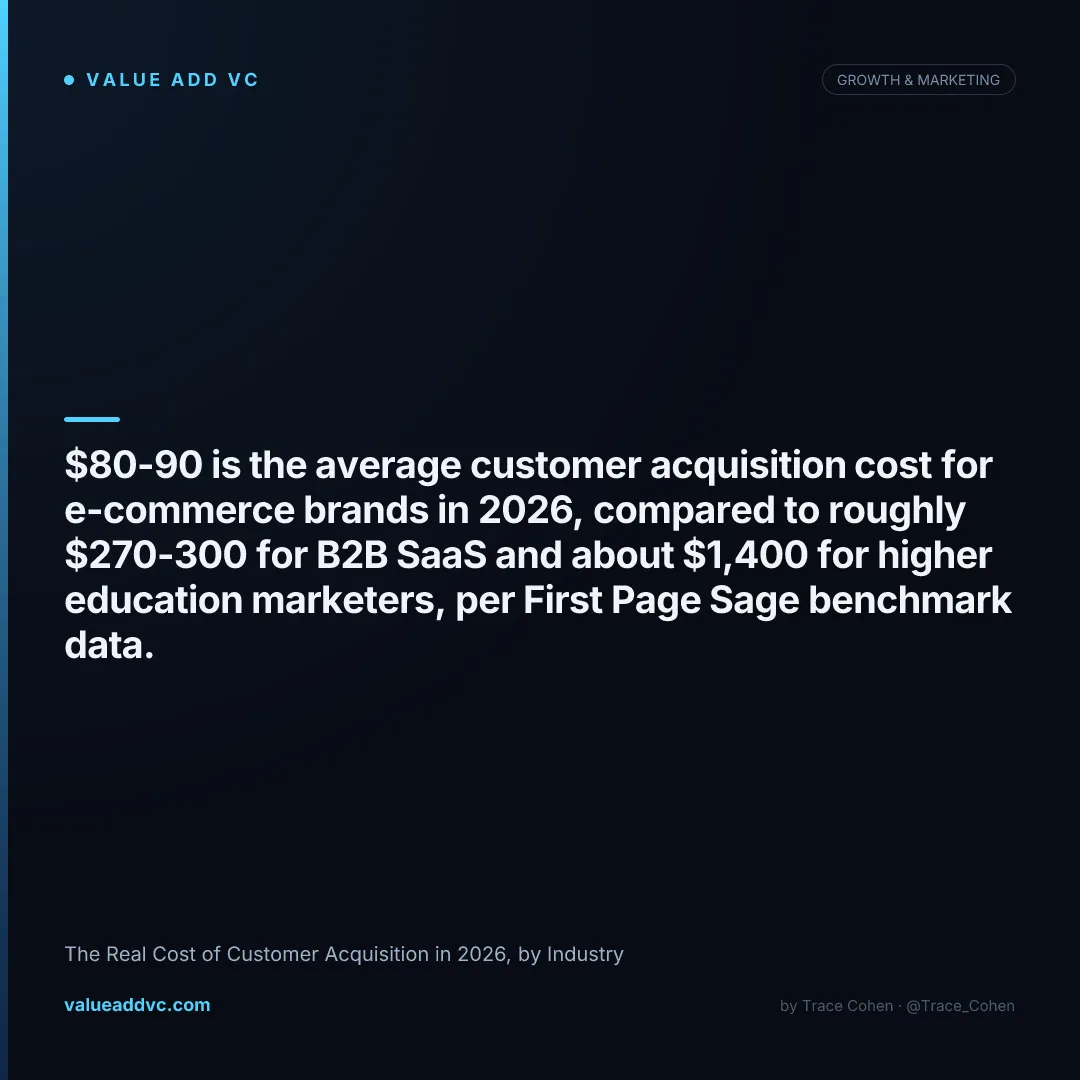
Customer acquisition cost ranges from about $80 for an e-commerce brand to roughly $1,400 for a higher-education marketer in 2026 — a 17x spread that has almost nothing to do with which industry markets better. I think CAC gets treated as a report-card number when it's really a function of sales-cycle length and customer lifetime value, and comparing your CAC to a different industry's benchmark is close to meaningless without those two numbers attached.
Founders and marketers ask "is my CAC too high?" constantly, and the honest answer is almost always "compared to what?" A $900 CAC would be a crisis for a D2C snack brand and a bargain for a law firm's client-acquisition funnel. The number only means something next to lifetime value and payback period — which is where most CAC conversations should start, not end.
Source: First Page Sage, 2026 CAC Benchmarks; Bessemer Venture Partners, Scaling to $100 Million.
The real spread: CAC by industry in 2026
First Page Sage's 2026 benchmark data puts e-commerce and food & beverage D2C brands at the low end, around $80-100 per customer, thanks to short purchase cycles and broad reach through paid social and search. B2B SaaS sits in the middle at roughly $270-300. Commercial insurance runs about $590, financial services and legal services land around $900-950, and higher education — with its long consideration window and high-stakes decision — tops the list at roughly $1,400 per acquired customer.
Why the raw CAC number is the wrong thing to chase
CAC only tells you what you spent. It doesn't tell you whether that spend was worth it, which is why LTV:CAC ratio and payback period matter more than the headline figure. A 3:1 LTV-to-CAC ratio is the widely used floor for a healthy business — a customer needs to generate roughly three times what it cost to win them over their lifetime. First Page Sage's data puts average B2B customer lifetime value at about $32,414 versus $10,089 for B2C, which is exactly why B2B companies can sustainably absorb a CAC many multiples higher than an e-commerce brand's: the lifetime value backing it up is proportionally larger too.
Payback period adds the time dimension LTV:CAC ratios miss. Bessemer Venture Partners' widely used framework targets a CAC payback under 12 months for SMB-focused SaaS accounts, under 18 months for mid-market accounts, and under 24 months for enterprise accounts. The looser target at the enterprise tier isn't a lower bar — it reflects that enterprise customers churn less and carry a higher lifetime value, so a company can afford to wait longer to recover the acquisition cost.
Channel matters as much as industry
Within any single industry, the acquisition channel moves CAC almost as much as the industry label does. HubSpot's benchmark data puts average B2B SaaS CAC at roughly $205 through organic channels versus $341 through paid channels — a 66% premium for paid acquisition within the same industry and business model. That gap is the practical argument for treating organic and paid as separate line items with separate targets rather than blending them into one company-wide CAC number that obscures which channel is actually earning its budget.
What the headline misses
These figures are averages across a wide range of company sizes, channels, and go-to-market motions within each industry label, and the underlying methodology varies by research firm — a different benchmark provider measuring the same industry can land on a meaningfully different number depending on which cost buckets (ad spend only, versus fully loaded sales and marketing headcount) it includes in "acquisition cost." A founder should treat any single-number industry benchmark as a directional anchor, not a precise target to hit.
It's also worth noting that CAC has been rising broadly across digital channels as platform ad costs climb with more advertisers competing for the same inventory, so a company holding CAC flat year-over-year in a rising-cost environment is actually improving efficiency in real terms, even if the raw number looks unchanged next to a stale benchmark.
Bottom line: The 17x gap between e-commerce's ~$80 CAC and higher education's ~$1,400 CAC isn't a scoreboard — it's a reflection of how long each industry's sales cycle runs and how much lifetime value sits on the other side of that cost. Before comparing your CAC to any industry average, pair it with your own LTV:CAC ratio and payback period; those two numbers tell you whether your acquisition spend is actually working far better than the raw dollar figure ever will.
Latest from the Pulse
Get VC data most people never see
— 100% free
Weekly benchmarks, valuations, and fund data. Join 5,000+ investors. No spam.