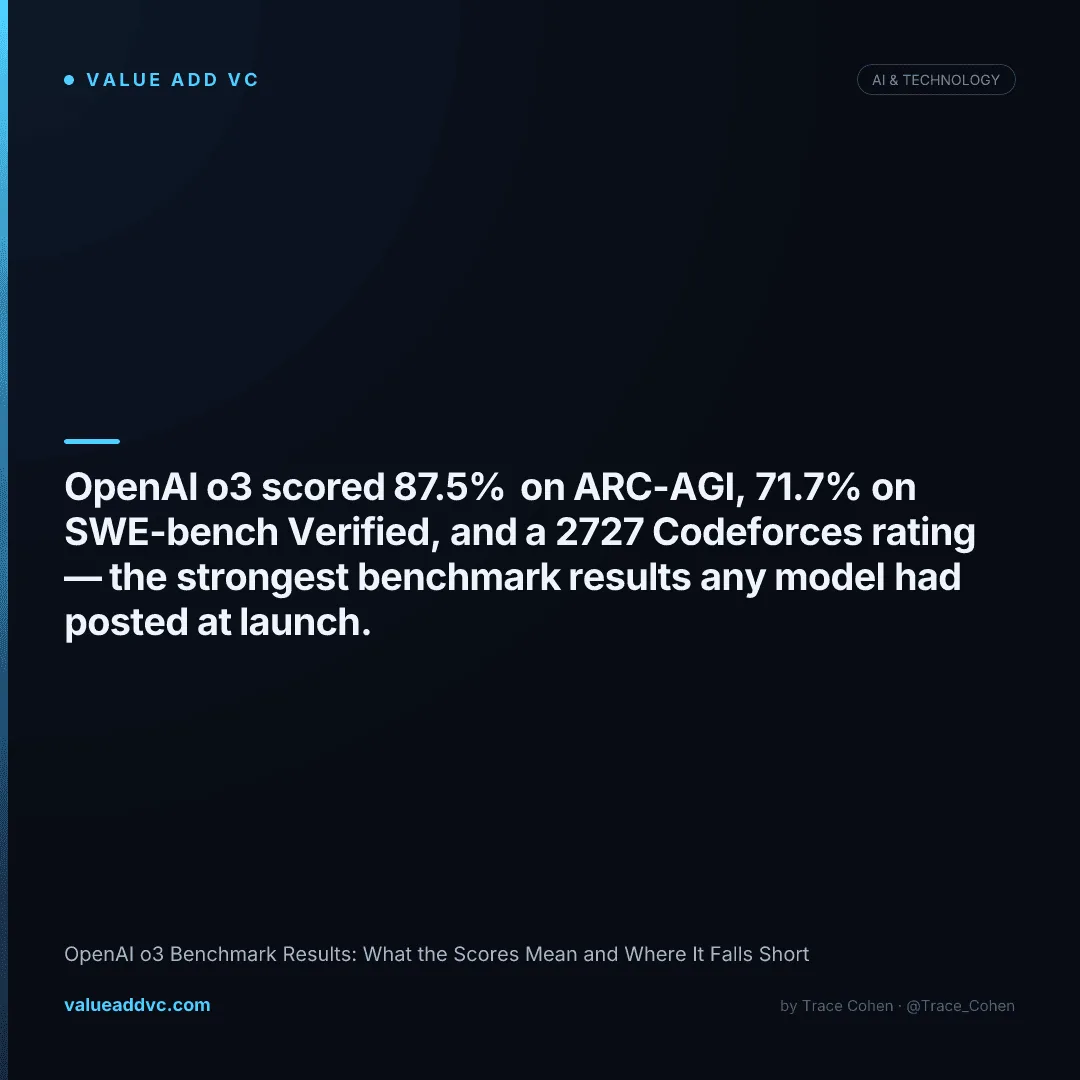
OpenAI o3 scored 87.5% on ARC-AGI, 71.7% on SWE-bench Verified, and a 2727 Codeforces rating — the strongest benchmark results any model had posted at launch. That's the short answer. The longer answer is more interesting.
Every one of those numbers is real and verified. But the headline 87.5% came from a compute configuration the ARC Prize team estimated cost thousands of dollars per task, and on the hardest benchmark — research-grade FrontierMath — o3 still missed nearly three out of four problems. The gap between "record benchmark score" and "reliable in production" is the whole story here.
OpenAI o3 Benchmark Results: The Full Numbers
OpenAI o3 is the reasoning model OpenAI previewed in December 2024 and rolled out through 2025, and its benchmark results set records across math, coding, science, and abstract reasoning. It scored 87.5% on ARC-AGI in high-compute mode, 71.7% on SWE-bench Verified, 96.7% on AIME 2024, 87.7% on GPQA Diamond, and earned a 2727 Codeforces rating — but the highest scores depend on compute settings far beyond what the shipped product uses.
| Benchmark | o3 Score | o1 Score | What It Measures |
|---|---|---|---|
| ARC-AGI (high-compute) | 87.5% | ~32% | Abstract visual reasoning on novel puzzles |
| ARC-AGI (low-compute) | 75.7% | ~25% | Same test, constrained compute budget |
| SWE-bench Verified | 71.7% | 48.9% | Real-world GitHub bug fixes |
| AIME 2024 | 96.7% | 83.3% | Competition high-school math |
| GPQA Diamond | 87.7% | 78.0% | PhD-level science questions |
| Codeforces (Elo) | 2727 | 1891 | Competitive programming rating |
| FrontierMath | 25.2% | ~2% | Unpublished research-grade math |
Scores as reported by OpenAI and the ARC Prize Foundation at o3's December 2024 preview. Production o3 and o3-mini tiers post lower numbers at far lower cost.
What the ARC-AGI Benchmark Result Actually Proved
ARC-AGI is the benchmark that mattered most, because it was designed to be resistant to memorization. Created by François Chollet in 2019, it presents grid puzzles a human solves in seconds but that had stumped every large language model — GPT-4o scored around 5%, and the prior state of the art sat near 55%. o3 jumping to 87.5% on the semi-private evaluation set crossed the 85% threshold associated with human-level performance on the test, the first model ever to do so.
But the cost is the asterisk on the whole result. The ARC Prize team reported that o3's high-compute run used roughly 172x the compute of its low-compute setting and, by their estimate, cost thousands of dollars per task to reach 87.5%. The low-compute configuration — still expensive — landed at 75.7%. This is not a model you point at a problem and get an answer back for a fraction of a cent. The benchmark proves the capability exists; it does not prove the capability is economical.
The compute caveat in one line
The 87.5% ARC-AGI score and the o3 you actually call through the API are not the same configuration. The record number is a demonstration of ceiling capability under near-unlimited compute, not the everyday product. Track how that capability is priced on the AI Valuations dashboard.
o3 vs o1 Benchmark Results: The Generational Jump
The clearest way to read o3's benchmark results is against o1, the model it replaced. The gains were not incremental. SWE-bench Verified — arguably the most practically relevant benchmark, since it measures fixing real bugs in real repositories — rose from 48.9% to 71.7%, a 22.8-point jump. The Codeforces rating climbed 836 points to 2727, which the company said placed it above roughly 99.95% of human competitive programmers and inside the global top ~175.
AIME 2024 went from 83.3% to 96.7%, meaning o3 missed on average a single question across the exam. The most dramatic delta was FrontierMath, a benchmark of unpublished problems built with input from professional mathematicians, where o1-level models scored about 2% and o3 reached 25.2%. That is more than a 10x gain on the hardest math test in existence — and simultaneously a reminder that the frontier model still fails 74.8% of those problems.
SWE-bench Verified
+22.8 pts
48.9% → 71.7%
Codeforces Elo
+836
1891 → 2727
FrontierMath
~10x+
~2% → 25.2%
Where the o3 Benchmark Results Fall Short
Here is the part the launch headlines skipped. Benchmark scores measure narrow capability under ideal conditions, and o3 falls short in four ways that matter once you move from a leaderboard to a real workflow.
How to Read AI Benchmark Results Like an Investor
I look at 65+ portfolio companies trying to build on top of these models, and the lesson o3 drives home is that benchmark results are a sales document, not a spec sheet. Three questions separate a meaningful score from a marketing one. First: at what compute and cost? An 87.5% that costs thousands of dollars per task tells you about a research ceiling, not a deployable product. Second: was the test set held out? A score on a contaminated benchmark measures memorization, not reasoning. Third: does the benchmark resemble your actual work? SWE-bench Verified at 71.7% is a far better predictor of coding-agent usefulness than a 2727 Codeforces rating, because real engineering looks more like fixing repo bugs than solving competition puzzles.
The same discipline applies whether you're pricing an AI startup or picking a model for production. The companies winning enterprise contracts aren't the ones with the highest leaderboard number — they're the ones whose real-world reliability matches their marketing. You can see how that capability premium flows into private valuations on the AI Valuations dashboard, and how the hyperscalers are funding the compute behind these scores on the AI Spending tracker.
o3's benchmark results were genuinely historic — and genuinely incomplete.
87.5% on ARC-AGI proved the capability exists. The thousands-of-dollars-per-task price proved it isn't free yet.
Track AI model economics and valuations on the AI Valuations Dashboard at Value Add VC. Originally published in the Trace Cohen newsletter.
Get VC data most people never see
— 100% free
Weekly benchmarks, valuations, and fund data. Join 5,000+ investors. No spam.