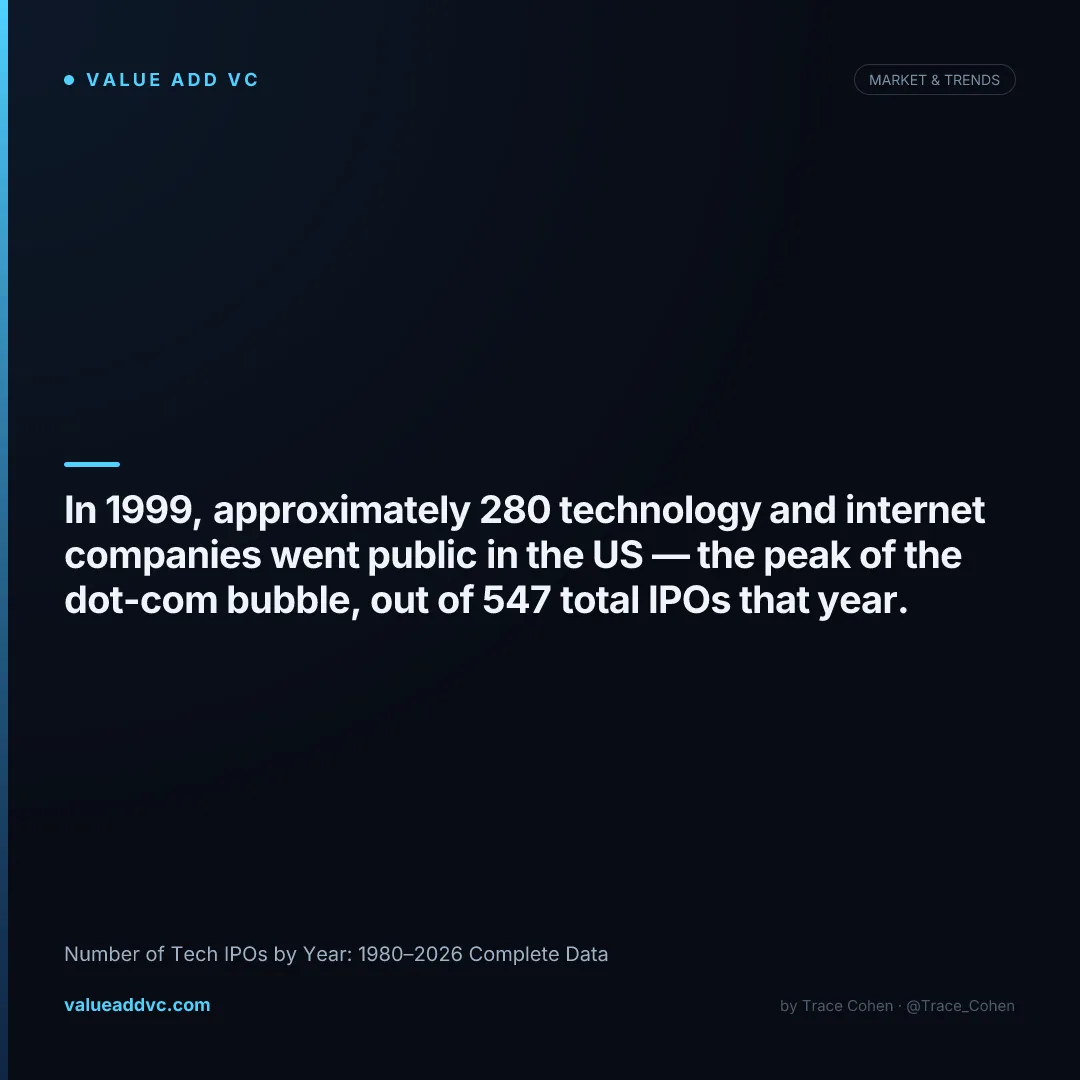
In 1999, 370 technology and internet companies went public in the United States — the highest number, and the highest concentration, of tech IPOs in any single year before or since.
That was out of 476 operating-company IPOs that year — 78% of the total, according to Jay Ritter's IPO statistics (Table 4h). The math tells the story: 1999's tech IPOs raised $33.5B, more than half of the $64.7B raised in operating-company IPOs that year (Tables 1 and 4e). Only 14% of those tech companies were profitable when they went public, and their median trailing sales were just $20.7M in 2022 dollars (Table 4b). Many had business models that would evaporate within 24 months.
The number of tech IPOs per year is one of the best leading indicators of where we are in the market cycle — and how much irrational exuberance is present at any given moment. Here is the complete data from 1980 through 2026, with context on what drove each wave.
Number of Tech IPOs by Year: The Complete Data
The 1980–2025 counts below come from a single source and definition: Table 4h of Jay Ritter's IPO statistics (University of Florida; IPO data page). Ritter counts operating-company IPOs only: he excludes SPACs, ADRs, unit offers, penny stocks (offer price below $5), small best-efforts offers, REITs, closed-end funds, banks and S&Ls, natural-resource partnerships, and stocks not listed on NYSE, Nasdaq, or Amex. Direct listings are not counted. "Tech" means internet-related and other technology companies, including telecom but not biotech, defined by SIC code. These counts are more conservative than headline IPO tallies, which often include SPACs and penny stocks. The 2026 row uses Renaissance Capital's IPO stats, which use a different definition.
| Year | Operating-Co. IPOs | Tech IPOs | Tech % | Notable Event |
|---|---|---|---|---|
| 1980 | 71 | 22 | 31% | Apple IPO (Dec) |
| 1981 | 192 | 72 | 38% | — |
| 1982 | 77 | 42 | 55% | — |
| 1983 | 451 | 173 | 38% | — |
| 1984 | 171 | 50 | 29% | — |
| 1985 | 186 | 37 | 20% | PC era matures |
| 1986 | 393 | 77 | 20% | — |
| 1987 | 285 | 59 | 21% | — |
| 1988 | 105 | 28 | 27% | — |
| 1989 | 116 | 35 | 30% | — |
| 1990 | 110 | 32 | 29% | Gulf War slowdown |
| 1991 | 286 | 71 | 25% | Recovery begins |
| 1992 | 412 | 115 | 28% | Microsoft era |
| 1993 | 510 | 127 | 25% | Pre-internet boom |
| 1994 | 402 | 115 | 29% | Rates rising |
| 1995 | 462 | 205 | 44% | Netscape IPO |
| 1996 | 677 | 276 | 41% | Internet frenzy |
| 1997 | 474 | 174 | 37% | Amazon IPO |
| 1998 | 283 | 113 | 40% | Russia crisis |
| 1999 | 476 | 370 | 78% | Dot-com peak 🔺 |
| 2000 | 380 | 261 | 69% | Bubble bursting |
| 2001 | 80 | 24 | 30% | Crash aftermath |
| 2002 | 66 | 20 | 30% | Near-zero activity |
| 2003 | 63 | 18 | 29% | Iraq War |
| 2004 | 173 | 61 | 35% | Google IPO |
| 2005 | 159 | 45 | 28% | Recovery continues |
| 2006 | 157 | 48 | 31% | Web 2.0 |
| 2007 | 159 | 76 | 48% | Pre-crisis peak |
| 2008 | 21 | 6 | 29% | Financial crisis |
| 2009 | 41 | 14 | 34% | TARP stabilizes |
| 2010 | 91 | 33 | 36% | Mobile boom |
| 2011 | 81 | 36 | 44% | LinkedIn IPO |
| 2012 | 93 | 40 | 43% | Facebook IPO |
| 2013 | 158 | 45 | 28% | Twitter IPO |
| 2014 | 206 | 53 | 26% | Alibaba ($25B; ADR, not counted) |
| 2015 | 118 | 38 | 32% | China slowdown |
| 2016 | 75 | 21 | 28% | Brexit uncertainty |
| 2017 | 106 | 30 | 28% | Snap, Okta |
| 2018 | 134 | 39 | 29% | Dropbox, DocuSign |
| 2019 | 113 | 37 | 33% | Uber, Lyft, Zoom |
| 2020 | 165 | 46 | 28% | SPAC boom begins (248 SPACs) |
| 2021 | 311 | 121 | 39% | SPAC peak (+613 SPACs) |
| 2022 | 38 | 6 | 16% | Rate hike crash |
| 2023 | 54 | 9 | 17% | Instacart; Arm (ADR, not counted) |
| 2024 | 72 | 14 | 19% | Reddit, ServiceTitan |
| 2025 | 90 | 31 | 34% | AI era begins |
| 2026 | 69† | — | — | SpaceX $1.77T listing (Jun 12); Anthropic, OpenAI filed |
Source: Jay Ritter, "Initial Public Offerings: Updated Statistics," Table 4h (Technology Company IPO Underpricing, 1980–2025; updated December 30, 2025), columns "Number of IPOs: Total / Tech". Tech % is Tech ÷ Total, rounded. Ritter's Table 1 and Table 4 (updated 2026) show 107 IPOs for 2017 and 73 for 2024 (15 tech in Table 4) after later additions; this table keeps the Table 4h figures throughout. Alibaba (2014) and Arm (2023) listed ADRs, which Ritter excludes. SPAC IPO counts are from Ritter's SPAC table. † 2026 is IPOs priced year-to-date through early June, per Renaissance Capital; not comparable to Ritter's definition, and no tech split is available.
1999: What Made the Dot-Com IPO Peak So Extreme
The 1999 tech IPO surge was not just about volume — it was about what companies were getting through the door. Consider: VA Linux Systems went public on December 9, 1999 and ended its first trading day up 697%, the largest opening-day gain in US history at the time. The stock was priced at $30, hit $320 intraday, and closed at $239. The company was two years old and deeply unprofitable.
Largest first-day gain in US history at the time
Server appliance company; acquired by Sun for $2B
CDN — one of the few to survive long-term
Open source Linux; IBM acquired for $34B in 2019
Customer e-mail management software
The average first-day return for all operating-company IPOs in 1999 was 71.2%, and 86.7% for tech IPOs, per Ritter's Tables 1 and 4h — numbers that have never been matched in any subsequent year. The highest annual average in 1980–1998 was 21.9%, in 1998. Issuers left $37.1B on the table in 1999 alone (first-day gains above the offer price). This tells you everything about the speculative fever of the moment. Institutional investors were flipping allocations immediately; retail investors were buying on open.
The Crash: 2001–2003
The Nasdaq peaked on March 10, 2000 at 5,048 and fell 78% over the next 30 months. The IPO market effectively closed. In 2001, only 80 operating-company IPOs occurred across all sectors, per Ritter. In 2002, that fell to 66. Technology accounted for just 44 IPOs across both years combined (24 and 20), down from 370 in 1999 alone.
Many of the companies that had gone public in 1999 and 2000 did not survive. Only 14% of 1999's 370 tech IPOs, and 13% of 2000's 261, were profitable when they went public (Ritter Table 4b). Many were later acquired for pennies on the dollar. Many more simply went bankrupt. The ones that survived — Akamai, Priceline, Salesforce (2004 IPO, but born in this era) — built real businesses behind the hype.
The Recovery Era: 2004–2019
Google's IPO in August 2004 — using a Dutch auction at $85/share, raising $1.67 billion — marked the real restart of the tech IPO market. It proved that profitable tech companies with defensible business models could access public markets even after the bubble.
The 2004–2019 recovery was characterized by far more mature IPO candidates than the 1999 era, and institutional investors who had been burned before. In Ritter's data, the median tech IPO from 2001–2025 had $134.2M in trailing sales (2022 dollars), versus $20.7M in 1999, and 32% were profitable, versus 14% in 1999 (Table 4b). The 2008–2009 financial crisis caused another temporary IPO freeze (21 operating-company IPOs in 2008), but the smartphone revolution and cloud software boom drove consistent activity through the 2010s.
2020–2021: The SPAC Boom and the Second Bubble
In 2020, the COVID-era stimulus and zero-interest-rate policy created a second bubble in public markets. SPAC (Special Purpose Acquisition Company) vehicles flooded the market, allowing companies that could not pass traditional IPO scrutiny to access public capital through reverse mergers. In 2021, 613 SPACs went public — nearly 2.5 times 2020's previous record of 248, per Ritter's SPAC data.
2021 Traditional IPO Highlights
- • Coinbase: Direct listing; closed day one at $328/share ($86B valuation)
- • Robinhood: $38/share ($32B market cap at IPO)
- • UiPath: $56/share ($29B valuation)
- • Rivian: $78/share ($67B at IPO — briefly hit $100B)
- • Duolingo: $102/share ($3.7B at IPO)
2021 SPAC Stats
- • 613 new SPACs launched
- • $144.5B raised in SPAC IPOs (Ritter; excludes overallotments)
- • 311 operating-company IPOs in the same year
- • Many SPACs later liquidated without completing a deal
- • SEC proposed new SPAC disclosure rules in 2022
2022–2026: Rate Hike Crash and the AI-Led Recovery
The Federal Reserve raised the federal funds rate from 0.25% in March 2022 to 5.5% by July 2023 — the fastest rate-hiking cycle in 40 years. Growth stocks, which had been valued on discounted future earnings, saw their multiples collapse. The IPO window slammed shut: only 38 operating-company IPOs occurred in all of 2022, and just 6 of them were tech companies, per Ritter.
The 2023 recovery was tentative. ARM Holdings, Instacart (Maplebear), and Klaviyo were the marquee offerings — all profitable or near-profitable, signaling that the market had returned to requiring fundamentals. Ritter counts 54 operating-company IPOs in 2023 (9 tech). 2024 brought 72 (14 tech), and 2025 delivered 90 (31 tech), as AI companies began to enter the pipeline.
2026 is shaping up as the most consequential IPO year in a generation. Roughly 69 traditional IPOs have priced year-to-date through early June (per Renaissance Capital), and Q1's 22 IPOs raising over $9.4B made it the strongest first quarter in five years per PwC. The mega-listings define the year: SpaceX lists on Nasdaq June 12 at $135/share — a $1.77 trillion valuation and a $75B raise, the largest IPO ever. Anthropic confidentially filed on June 1, shortly after a funding round at a $965B valuation on a roughly $47B revenue run rate, and OpenAI, valued at $852B, filed confidentially a week later. If even two of the three price as planned, 2026 IPO proceeds will dwarf every prior year on record.
Track the current IPO pipeline and valuation data on the Tech IPO Dashboard at Value Add VC.
What the IPO Count Tells You About Market Cycles
The number of tech IPOs per year is a cleaner signal than most macro indicators for where we are in the risk-appetite cycle. Here is the pattern across four complete cycles:
Tech IPO count spikes 30%+ above prior year trend; first-day returns run far above the 19.0% long-run average (1980–2025); money-losing companies dominate
1999: 370 tech IPOs, 71.2% average first-day return; 2020–2021: 861 SPAC IPOs
IPO count falls 70%+ in 12 months; only SPACs or near-zero activity remains
2001: 80 total (−79%); 2008: 21 total (−87%); 2022: 38 total (−88%)
1–2 landmark IPOs prove quality companies can still go public; window reopens cautiously
2004: Google; 2009: OpenTable; 2023: ARM
Tech accounts for roughly a quarter to a third of operating-company IPOs; companies need real metrics to price
2013–2019: tech share between 26% and 33% every year
The number of tech IPOs in any year is a symptom, not a cause.
When 370 tech companies go public in a year and the average one pops 87%, the market is telling you it has lost the ability to price risk. That lesson from 1999 has repeated in every subsequent bubble — and will again.
Track the current IPO pipeline, valuations, and market conditions on the Tech IPO Dashboard and the IPO tracker at Value Add VC.
Latest from the Pulse
Get VC data most people never see
— free to subscribe
Trace's notes on venture, AI and startups, a few times a week. Join 5,000+ subscribers. No spam.
No spam, unsubscribe anytime. Sent via Substack · Privacy · or subscribe on Substack ↗