Most SaaS companies should not be valued on EBITDA. And most eventually will be.
EV/EBITDA is the dominant valuation metric for mature, profitable software businesses — the ones that have stopped growing at 60% annually and started generating real cash. For early-stage SaaS that burns cash to acquire customers, EV/EBITDA produces nonsense numbers. A company doing $80M ARR with $2M EBITDA might trade at 400x EBITDA and 8x revenue simultaneously — the revenue multiple is far more informative.
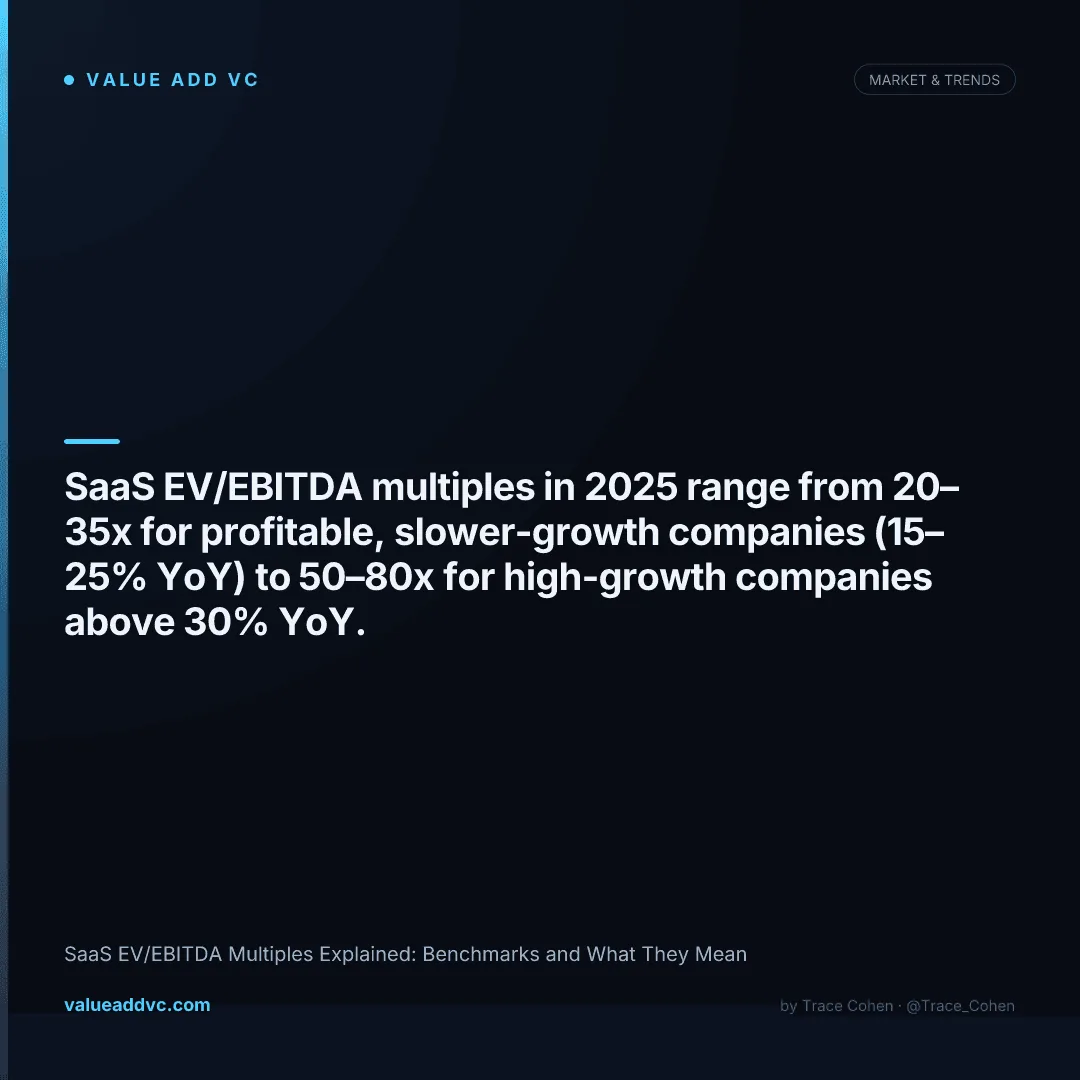
But once a SaaS business hits sustained profitability — generally above 15% EBITDA margin with growth stabilizing below 30% — EBITDA multiples become the language investors, PE buyers, and strategic acquirers use to price it. Understanding the current benchmarks and what drives the spread between 15x and 80x is essential for any founder or investor in the software market.
SaaS EBITDA Multiple Benchmarks for 2025
The benchmark varies dramatically by growth rate. High-growth SaaS is effectively not valued on EBITDA at all — investors pay for future earnings capacity. Here is the current market by segment:
| Growth Rate (YoY) | EBITDA Margin (Typical) | EV/EBITDA Range | Primary Metric Used |
|---|---|---|---|
| 40%+ (hypergrowth) | 0–10% | 60–100x+ | EV/NTM Revenue |
| 25–40% (high growth) | 10–20% | 40–70x | EV/NTM Revenue |
| 15–25% (mature growth) | 20–30% | 20–35x | EV/EBITDA or Revenue |
| 10–15% (steady-state) | 25–35% | 15–25x | EV/EBITDA |
| <10% (low growth) | 30–40% | 10–18x | EV/EBITDA |
| PE buyout target | 20%+ | 15–22x | EV/EBITDA at close |
Source: BVP Nasdaq Emerging Cloud Index, Bessemer State of the Cloud 2025, public SaaS comps as of Q1 2026.
Why SaaS EBITDA Multiples Are So High Relative to Other Sectors
Traditional businesses — manufacturing, retail, media — trade at 8–15x EBITDA. Software commands a structural premium for four reasons:
Recurring, predictable cash flows
Subscription revenue with 85–120% NRR produces more durable EBITDA than project-based or transactional revenue. Investors pay for certainty.
High incremental margins
Once a SaaS platform is built, serving the next customer costs almost nothing. Gross margins of 70–85% mean EBITDA scales dramatically with revenue growth.
Low capital intensity
SaaS requires no factories, inventory, or significant physical assets. EBITDA is nearly equivalent to free cash flow once capex is minimal — which drives higher multiples on each EBITDA dollar.
Defensible switching costs
SaaS embedded in core workflows (ERP, CRM, payroll) is sticky. Low churn makes future EBITDA more predictable, which supports higher present-value multiples.
Public SaaS Comps: EV/EBITDA in Practice
Looking at actual public SaaS companies as of early 2026 illustrates the spectrum. Companies with faster growth still trade primarily on revenue multiples, but EBITDA multiples are increasingly scrutinized as the market demands profitability discipline:
Salesforce (CRM)
Mature cash cow; market values EBITDA stability
EV/Rev: ~7x NTM
EV/EBITDA: ~22x
ServiceNow (NOW)
High-quality Rule of 40 compounder; premium warranted
EV/Rev: ~13x NTM
EV/EBITDA: ~45x
HubSpot (HUBS)
Thin EBITDA margin keeps EBITDA multiple elevated
EV/Rev: ~8x NTM
EV/EBITDA: ~55x
Zoom (ZM)
Low growth compresses to near-PE-level multiples
EV/Rev: ~4x NTM
EV/EBITDA: ~14x
Cloudflare (NET)
High growth + thin EBITDA = revenue-led pricing
EV/Rev: ~14x NTM
EV/EBITDA: ~90x
Approximate figures based on public market data, Q1 2026. Track live SaaS multiples on the SaaS Valuations Dashboard.
How PE Firms Use SaaS EBITDA Multiples
Private equity is increasingly the most active buyer of mature SaaS businesses. Unlike strategic acquirers, PE firms anchor entirely to EBITDA because they underwrite a model — not a strategic vision.
The typical PE SaaS deal today: buy at 15–22x trailing EBITDA using 40–50% debt, spend 3–5 years improving margins through pricing discipline and headcount efficiency, exit at 20–28x EBITDA to a strategic or public market. The return engine is margin expansion plus multiple expansion — not revenue growth.
Entry multiple
15–22x EBITDA
PE acquisition target range
Hold period
3–5 years
Typical PE ownership window
Exit multiple
20–28x EBITDA
Target at sale or IPO
Private Company SaaS EBITDA Multiples vs. Public Comps
Private SaaS companies receive a 20–30% haircut to public comps on both EV/Revenue and EV/EBITDA. The discount reflects illiquidity, smaller scale, and less operating leverage than public counterparts. For a public SaaS comp trading at 30x EBITDA, a comparable private company clears at 20–24x.
The discount narrows meaningfully for companies with ARR above $50M, NRR above 110%, and gross margins above 75%. At that quality threshold, strategic buyers often pay near-public-market multiples — especially if the target gives the acquirer a vertical wedge they cannot build internally.
For founders thinking about exit timing: the gap between public and private multiples has compressed since 2022. The post-correction environment rewards companies that can demonstrate both growth AND profitability simultaneously — which is exactly what high EBITDA multiples reward.
The shift from EV/Revenue to EV/EBITDA is not just accounting.
It signals that a SaaS company has crossed from a growth story into a cash flow story — and the market will price it accordingly.
Track live public SaaS valuation multiples on the SaaS Valuations Dashboard at Value Add VC. Originally published in the Trace Cohen newsletter.
Get VC data most people never see — free.
Weekly benchmarks, valuations, and fund data. No spam, unsubscribe anytime.