What Is a Cap Table?
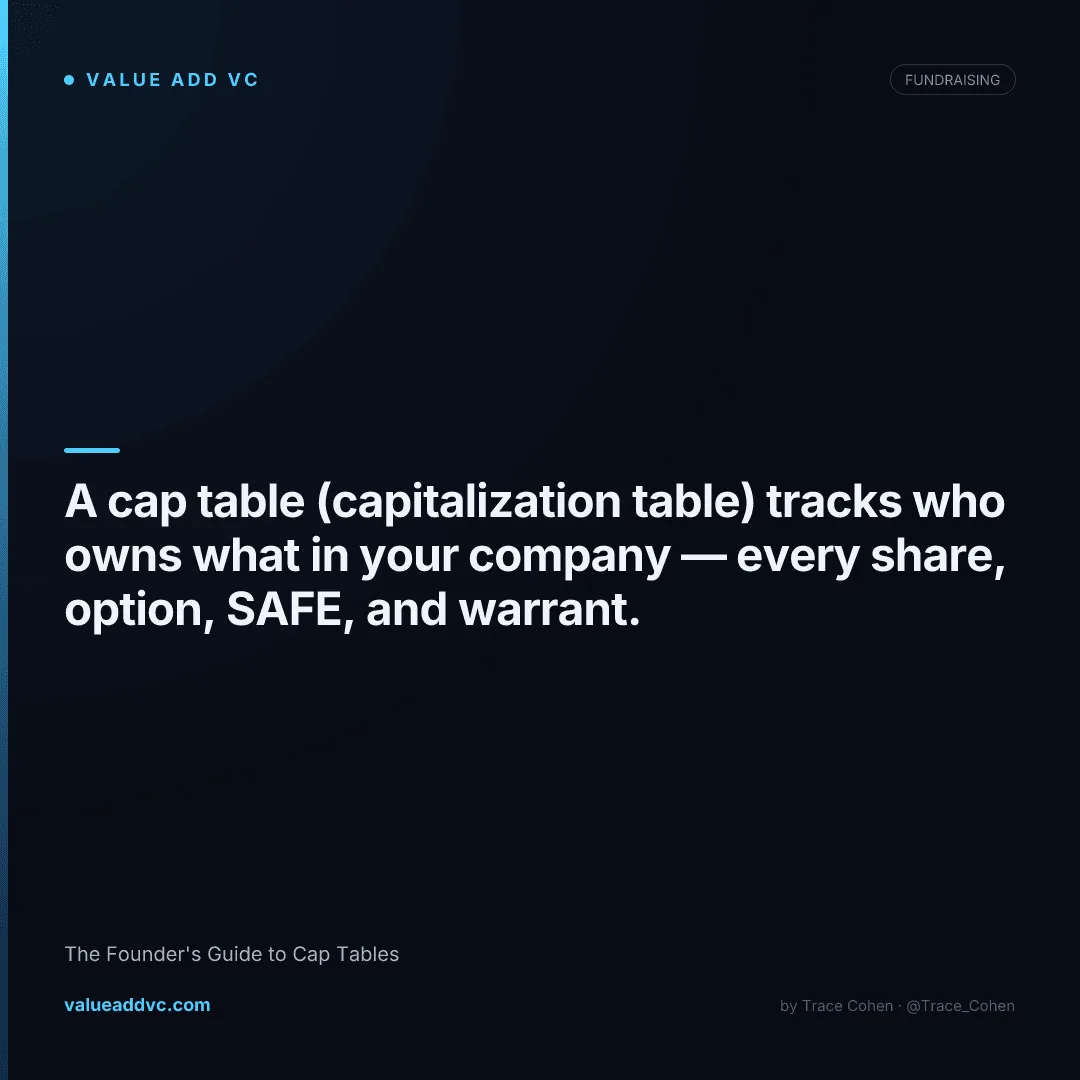
A capitalization table — universally called a cap table — is a spreadsheet or document that shows who owns what in your company. Every share, every option, every convertible instrument, every warrant. It is the single source of truth for ownership.
At its simplest, a cap table answers one question: if the company were sold today, who would get what? But in practice, it does much more than that. It tracks how ownership has evolved over time, models how future events (fundraising, option grants, conversions) will change the ownership structure, and provides the foundation for every financial and governance decision the company makes.
If you are a first-time founder, your cap table probably starts simple: two founders, maybe a few early advisors, and some reserved shares for an option pool. But it gets complex fast. After a SAFE note round, a seed round, and a Series A, your cap table might have 20-30 line items across multiple share classes, option grants in various stages of vesting, and convertible instruments that have not yet converted. Managing this complexity is not optional — it is critical.
Every founder should be able to read their cap table fluently. Not just the top-line numbers, but the mechanics: what happens when SAFEs convert, how the option pool affects dilution, what the liquidation waterfall looks like at different exit values. This guide will teach you all of it.
Anatomy of a Cap Table
A well-structured cap table has rows and columns that tell the complete ownership story. Here is what you will find:
Rows: The Stakeholders
Each row represents a person or entity that owns (or has the right to own) equity in the company:
- Founders: The people who started the company. They typically hold common stock, usually subject to vesting schedules. For more on how to split equity among founders, see our founder equity guide.
- Investors: Anyone who has put money into the company. They might hold preferred stock (from priced rounds), SAFEs, convertible notes, or warrants. Each investor appears with the specific instrument they hold.
- Employees and Advisors: People who have been granted stock options or restricted stock. These are typically drawn from the option pool and vest over time (usually 4 years with a 1-year cliff).
- Option Pool (Unallocated): The reserved shares that have not yet been granted to anyone. This is the "available" pool for future hires.
Columns: The Data Points
Each column tracks a specific piece of information about the stakeholder's ownership:
- Share class: Common, Series Seed Preferred, Series A Preferred, etc.
- Shares authorized: The total number of shares the company has authorized in its charter.
- Shares outstanding: Shares that have actually been issued to shareholders.
- Options granted: Stock options that have been issued to employees/advisors.
- Options vested vs unvested: How much of the option grant has been earned.
- Fully diluted shares: Total shares assuming all options are exercised and all convertible instruments convert. This is the number that matters most.
- Ownership percentage: Each stakeholder's percentage of the total fully diluted shares.
- Price per share: What the stakeholder paid (or what the shares were valued at when granted).
Pro Tip:
Always think in terms of fully diluted ownership. The "outstanding shares" view does not include unexercised options or unconverted SAFEs, which can paint a misleadingly rosy picture of your ownership. Fully diluted is the honest number.
How Dilution Works: From Founding to Series A
Dilution is the reduction in existing shareholders' ownership percentage when new shares are issued. It is not inherently bad — dilution in exchange for capital that increases the company's value is a good trade. The problem is when founders do not understand how much dilution is coming and fail to plan for it.
Let us walk through a complete example, starting from day one.
Stage 1: Founding
Total Shares: 10,000,000
Founder A: 6,000,000 shares (60%)
Founder B: 4,000,000 shares (40%)
Clean and simple. Two co-founders split the company 60/40 based on their relative contributions, roles, and IP. All shares vest over 4 years with a 1-year cliff.
Stage 2: Option Pool Creation (10%)
New shares created for option pool: 1,111,111
Total Shares: 11,111,111
Founder A: 6,000,000 shares (54.0%)
Founder B: 4,000,000 shares (36.0%)
Option Pool: 1,111,111 shares (10.0%)
The founders created a 10% option pool to attract early employees. Notice both founders diluted proportionally. The pool comes from new shares, which dilutes everyone equally.
Stage 3: SAFE Round ($500K at $5M Post-Money Cap)
SAFE Ownership: $500K / $5M = 10%
SAFE Shares at conversion: 1,234,568
Total Shares: 12,345,679
Founder A: 6,000,000 shares (48.6%)
Founder B: 4,000,000 shares (32.4%)
Option Pool: 1,111,111 shares (9.0%)
SAFE Investors: 1,234,568 shares (10.0%)
The SAFE investors converted at 10% of the company. Everyone else diluted. Founder A went from 54% to 48.6%. The option pool shrunk from 10% to 9%.
Stage 4: Series A ($3M at $12M Pre-Money, 15% New Option Pool)
New option pool shares: 2,175,926 (to reach 15% post-money)
Pre-money shares (incl new pool): 14,521,605
Series A price: $12M / 14,521,605 = $0.826/share
Series A shares: $3M / $0.826 = 3,630,401
Total Shares: 18,152,006
Founder A: 6,000,000 shares (33.1%)
Founder B: 4,000,000 shares (22.0%)
Option Pool: 3,287,037 shares (18.1%)
SAFE Investors: 1,234,568 shares (6.8%)
Series A Investors: 3,630,401 shares (20.0%)
After the Series A, Founder A owns 33.1% — down from 60% at founding. That is 27 percentage points of dilution across one option pool creation, one SAFE round, another option pool increase, and one priced round. This is completely normal. The key question is whether the company is worth more at 33% than it was at 60%. If the Series A values the company at $15M post-money, Founder A's shares are worth nearly $5M on paper. At founding, 60% of nothing was nothing.
This walkthrough illustrates the fundamental principle of startup dilution: a smaller piece of a bigger pie is usually more valuable than a bigger piece of a smaller pie. But only if you understand the math and plan for it. For more on how valuations work at each stage, see our guide on startup valuations.
Option Pool Mechanics
The option pool is one of the most misunderstood parts of the cap table. Here is how it actually works.
When you create an option pool, you authorize new shares and reserve them for future grants. These shares are not yet issued to anyone — they sit in the pool until you grant them to an employee or advisor. But they count toward your fully diluted share count immediately, which means they dilute existing shareholders the moment they are created, not when they are granted.
This is why investors insist on the option pool being created from the pre-money valuation. From their perspective, the pool is a cost of doing business, and it should be borne by the existing shareholders (the founders), not the new investors. From the founders' perspective, this is a negotiation point — the larger the pool, the more dilution before the investor even puts money in.
How to Negotiate the Pool Size:
- Build a hiring plan: List every hire you plan to make between this round and the next, along with their expected option grant size. Add it up. That is your pool.
- Use market data: Reference industry benchmarks for option grants at your stage and for each role. A VP of Engineering at a Series A company typically gets 0.5-1.5%. A senior engineer might get 0.1-0.3%.
- Push back on oversized pools: If the VC wants 20% and your hiring plan only requires 12%, negotiate to 12-15%. Every extra point in the pool is unnecessary dilution. Unused options just sit there, diluting you for no reason.
SAFE Conversion Impact on Your Cap Table
SAFEs are invisible on your cap table until they convert. This is both a feature and a bug. The feature: simplicity during the early days. The bug: founders often underestimate how much dilution is hiding in their unconverted SAFEs.
When a priced round occurs, all outstanding SAFEs convert simultaneously. The order of operations matters:
- 1. The new option pool is created (if required by the new investors)
- 2. SAFEs convert into shares based on their respective caps and discounts
- 3. The new investors' shares are issued at the round price
The impact on founders can be significant, especially if you have stacked multiple SAFEs at different caps. Consider a scenario where you have three SAFEs:
SAFE 1: $200K at $4M post-money cap = 5.0%
SAFE 2: $300K at $6M post-money cap = 5.0%
SAFE 3: $250K at $8M post-money cap = 3.1%
Total SAFE dilution: ~13.1%
That is 13% of your company spoken for before the Series A investors take their share and before the new option pool is carved out. If the Series A takes 20% and the new pool is 15%, founders are left with roughly 52% of the company. If there were two co-founders splitting equally, that is 26% each — and every additional round will dilute further.
This is not necessarily a problem if the company is growing in value, but it is a problem if founders did not see it coming. Model your SAFE conversions before you stack them. Use our SPV Calculator to run the numbers.
Modeling Scenarios: What-If Analysis
A static cap table shows you where you are today. A dynamic cap table model shows you where you could be tomorrow. Every founder should be able to model these scenarios:
Next Round Dilution
If you raise a Series B at $40M pre-money with a $8M round, the Series B investors get 16.7% ($8M / $48M). Model what that does to everyone on the cap table. How much do the founders dilute? How much do the Series A investors dilute? What percentage does the option pool drop to?
Exit Waterfall Analysis
This is the most important model you can build. Take your current cap table and model what happens at different exit values: $20M, $50M, $100M, $500M. Who gets what? The liquidation preferences are paid first, then the remaining proceeds are split among common shareholders (or preferred shareholders who choose to convert). At lower exit values, the liquidation preferences can eat most or all of the founders' payout. At higher exit values, preferences become less significant.
Down Round Impact
What happens if your next round is at a lower valuation? Model the anti-dilution adjustment. If your Series A has broad-based weighted average anti-dilution, the Series A investors get additional shares to partially compensate for the lower valuation. This additional dilution comes from the founders and other common shareholders. Understanding this before it happens helps you negotiate better anti-dilution terms.
Cap Table Tools and Software
In the early days, a spreadsheet is fine. But as your cap table grows in complexity, dedicated software becomes essential. Here are the main options:
- Carta: The market leader. Handles cap table management, 409A valuations, equity plan administration, and investor reporting. Most VCs expect their portfolio companies to be on Carta. It is not cheap, but it is comprehensive. Good for Series A and beyond.
- Pulley: A newer alternative to Carta, focused on being simpler and more affordable for earlier-stage companies. Good UX, solid modeling tools, and competitive pricing. Strong option for seed-stage companies.
- AngelList (now Roll): Particularly useful if you are raising from angels or using rolling SAFEs. Integrates cap table management with fundraising tools.
- Spreadsheet (Google Sheets / Excel): Perfectly fine for pre-seed and early seed. Build your own model, understand every cell, and switch to software when the complexity justifies the cost. The understanding you build from managing your own spreadsheet is invaluable.
Regardless of which tool you use, the founder should always understand the underlying math. Do not outsource cap table knowledge to your lawyer or your software. You need to be able to model scenarios, explain dilution to co-founders, and negotiate intelligently with investors. Tools are aids, not substitutes for understanding.
Common Cap Table Mistakes
1. Not Tracking SAFEs on the Cap Table
Because SAFEs do not convert until a priced round, many founders do not include them on their cap table at all. This is a dangerous oversight. You should always maintain a pro forma cap table that shows what ownership would look like if all SAFEs converted today. Otherwise, you are flying blind on your actual dilution.
2. Giving Away Too Much Equity Too Early
Early-stage founders sometimes give large equity grants to advisors, early employees, or service providers without thinking about the cumulative effect. A 2% advisor grant here, a 1% consultant grant there, another 1.5% for a part-time CTO — suddenly 5-10% of the company is spoken for before you have raised a dollar. Every percentage point matters. Be deliberate and use standard vesting schedules for everyone.
3. Not Vesting Founder Shares
If you have two co-founders and one leaves after 6 months with 50% of the company, you have a catastrophic cap table problem. No investor will touch a company where a departed co-founder holds a massive equity stake. Always vest founder shares — the standard is 4 years with a 1-year cliff. Some investors will require this at the term sheet stage, but you should do it from day one.
4. Not Maintaining a Clean Cap Table
During due diligence, investors will scrutinize your cap table. Missing records, unsigned stock purchase agreements, options granted without board approval, or discrepancies between your spreadsheet and your legal documents can delay or kill a deal. Keep your cap table clean from day one. Every equity event should be documented, approved, and reflected in your records.
5. Issuing Shares Without a 409A Valuation
When you grant stock options, the exercise price must be at or above the fair market value of the common stock on the date of the grant. This fair market value is determined by an independent 409A valuation. If you grant options without a current 409A, the IRS can reclassify the grants as taxable income to the employees and impose significant penalties. Get a 409A before you start granting options. Update it annually and after any material event (fundraise, significant revenue change, etc.).
6. Misunderstanding Fully Diluted vs Outstanding
When someone asks "what percentage do I own?" the answer depends on whether you are counting outstanding shares (only shares that have been issued) or fully diluted shares (all outstanding shares plus all shares that could be issued — options, warrants, convertible instruments). Investors always think in fully diluted terms. Founders sometimes quote outstanding numbers because they look better. This disconnect causes confusion and mistrust. Always use fully diluted.
Final Thoughts
Your cap table is not just an administrative document — it is the financial architecture of your company. Every decision you make about equity, fundraising, and hiring changes it, often permanently. The founders who master their cap table make better decisions about dilution, negotiate more effectively with investors, and avoid the silent mistakes that erode ownership over time.
Start simple. Build your own spreadsheet before you use software. Model every scenario. Understand the math behind every share, every option, and every convertible instrument. And never, ever sign a SAFE or a term sheet without modeling its impact on your cap table first.
For a complete education on how venture capital works — from cap tables to term sheets to fund mechanics — check out the Value Add VC book.
Get VC data most people never see
— 100% free
Weekly benchmarks, valuations, and fund data. Join 5,000+ investors. No spam.