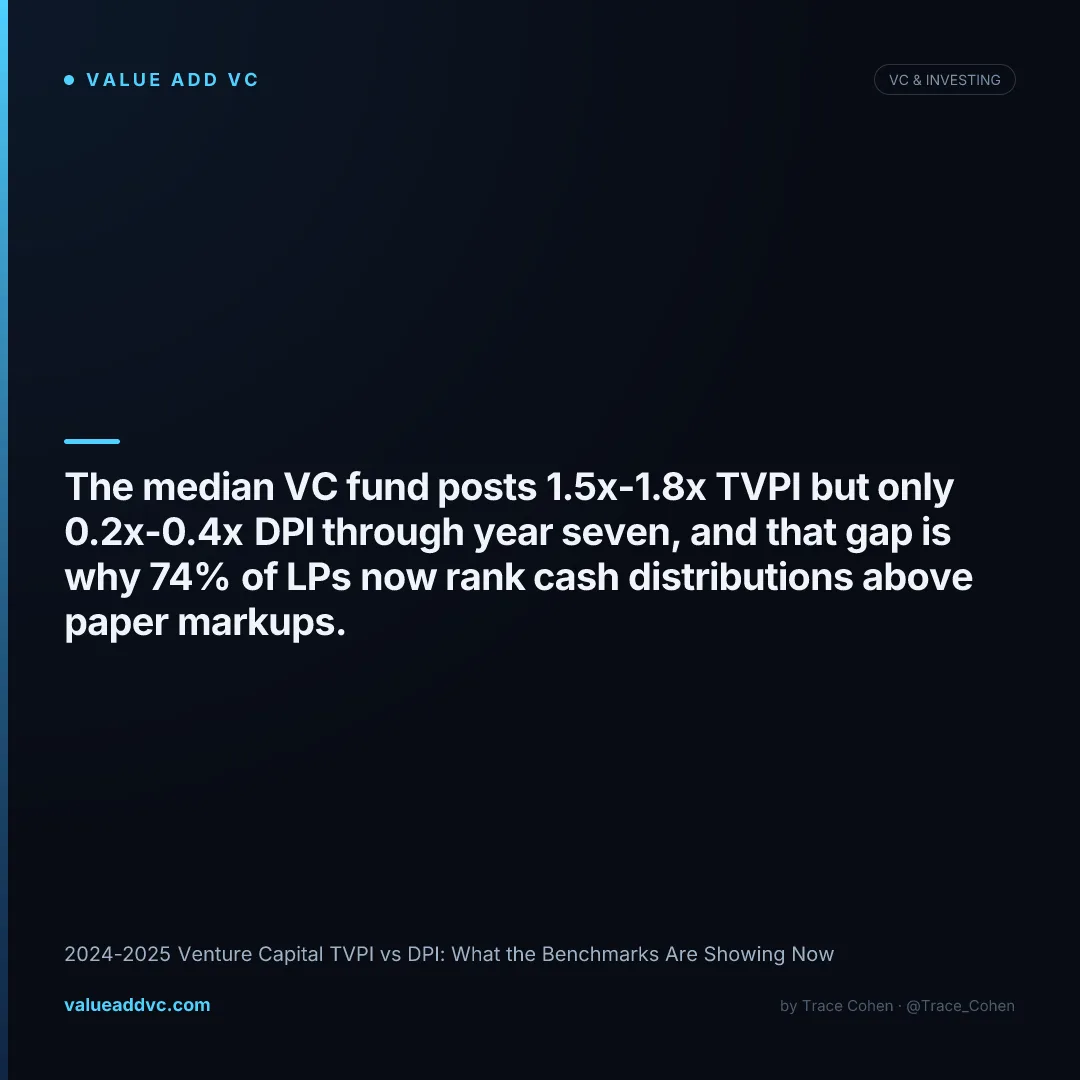
The median VC fund shows 1.5x-1.8x TVPI in 2025, but its DPI — actual cash returned to LPs — sits closer to just 0.2x-0.4x through year seven. That's the short answer. The longer answer is more interesting.
A fund can look great on paper and still hand its LPs nothing back for a decade. That's exactly what's happening across most of the 2018-2022 vintage classes right now, and it's why the conversation among LPs has shifted almost entirely from "what's your IRR" to "what's your DPI."
I've sat on both sides of this conversation — raising capital and deciding where to deploy it — and the TVPI-DPI gap has become the single most important thing LPs interrogate before writing a re-up check. Here's what the 2024-2025 data actually shows, vintage by vintage.
Sources: Carta VC Fund Performance Q4 2025, PitchBook, Cambridge Associates Private Investment Benchmarks, checked July 2026.
2024-2025 Venture Capital TVPI vs DPI: The Benchmarks Compared
TVPI and DPI diverge because TVPI counts unrealized paper markups while DPI counts only cash a fund has actually distributed to LPs. As of Carta's Q4 2025 VC Fund Performance report, the median VC fund sits at 1.5x-1.8x TVPI but only 0.2x-0.4x DPI through year seven, meaning roughly 80-90% of reported fund value hasn't converted to cash yet.
| Vintage Year | Median TVPI | Median DPI | Top-Quartile TVPI | Net IRR (median) | Status |
|---|---|---|---|---|---|
| 2017 | 1.76x | 0.9x | 2.27x | 13% | Mature, distributing |
| 2018 | 1.7x | 0.6x | 2.9x | 12% | Majority returned $0 through 2024 |
| 2019 | 1.65x | 0.35x | 2.9x | 12% | Weakest 5-yr DPI since 2006 |
| 2020 | 1.6x | 0.25x | 2.6x | 11% | Over 50% now generating some DPI |
| 2021 | 1.3x | 0.1x | 2.0x | 8% | 30-50% markdowns from peak |
| 2022 | 1.4x | 0.05x | 2.1x | 9% | Outperforming 2021 by 20-30% |
| 2023-2024 | 1.1x | 0.01x | 1.5x | n/m | Too early to benchmark |
Figures blended from Carta VC Fund Performance reports (Q4 2024-Q4 2025), PitchBook exit and distribution data, and Cambridge Associates Private Investment Benchmarks. Vintage-level medians vary by data provider methodology; treat as directional.
TVPI vs DPI by Vintage Year: The Widening Gap
Carta VC Fund Performance, PitchBook, Cambridge Associates, checked July 2026
Why DPI Has Overtaken TVPI as the Metric LPs Actually Trust
DPI has overtaken IRR and TVPI as the primary re-up criterion because 74% of institutional LPs say realized cash matters more than paper markups after watching 2021-vintage TVPI marks get cut 30%-50% from their peaks. The 12-month distribution yield across the industry sits at 10.9% of NAV, well below the 19.6% decade average, and distribution rates have averaged single-digit percentages of NAV for eight consecutive quarters versus a 16.8% decade norm. The majority of funds raised since 2018 have returned exactly $0 to LPs, and even the 90th-percentile funds raised since 2017 have only distributed about half their called capital back. That's not a rounding error — that's a multi-year distribution crisis that has made TVPI, on its own, close to meaningless as a signal of what an LP will actually receive.
Is the TVPI-DPI Gap Closing in 2025-2026?
There are early, modest signs of improvement. More than half of all 2020-vintage funds have begun generating some DPI, and about 15% of those funds made a first-ever distribution to LPs sometime in 2025 — a meaningful unlock after years of zero cash back. The 2022 vintage is also outperforming the 2021 vintage by 20%-30% at the same age, suggesting underwriting discipline improved once the 2021 markdown wave forced GPs to reset entry prices. AI-focused funds across 2024-2026 vintages are outperforming non-AI funds at every stage, though it's still far too early to know how much of that AI-driven TVPI converts into real DPI.
| Signal | 2025 Data Point | Read |
|---|---|---|
| 2020 vintage DPI activation | >50% now generating some DPI | Positive, but from a near-zero base |
| First-time distributions | ~15% of 2020 funds, first in 2025 | Slow unlock, not a flood |
| 2021 vintage markdowns | 30-50% below peak | TVPI overstated capital's true worth |
| 2022 vs 2021 vintage | Outperforming by 20-30% | Discipline improved post-reset |
| Funds raised since 2018 with $0 DPI | Majority | Distribution crisis is still the base case |
| 90th-percentile funds since 2017 | ~0.5x DPI returned | Even top performers lag on cash |
Sources: Equitybee DPI Performance Reports Q1-Q2 2025, PitchBook, Carta, checked July 2026.
TVPI vs DPI: What It Means for LPs Deciding Whether to Re-Up
If you're an LP evaluating a re-up, treat TVPI as a hypothesis and DPI as the evidence. A GP pitching 1.8x TVPI with 0.1x DPI at year six is asking you to trust that unrealized value converts to cash in an environment where distribution yields are running at roughly half the decade average. That's a real ask, not a formality — the 2019 vintage's weak five-year DPI and the 2021 vintage's 30%-50% markdowns both show TVPI can overstate reality for years before the correction shows up. Understanding how MOIC and TVPI actually work on a cap table helps clarify why paper markups shouldn't drive your allocation decisions. Funds that are already showing DPI traction, even at 0.3x-0.5x, deserve a premium in your evaluation over funds with a higher TVPI but zero cash back, because DPI can't be marked down the way paper gains can. You can benchmark your own portfolio's TVPI and DPI against these vintage cohorts on our VC performance dashboard, and compare against private equity benchmarks on our VC vs PE performance tool.
Bottom line: DPI wins this comparison for anyone actually deciding where to put new capital. TVPI is still useful as an early directional signal, but the 2024-2025 data shows a median fund sitting at 1.5x-1.8x TVPI while distributing only 0.2x-0.4x in cash — a gap that's stayed wide for three straight vintage years running. Until distribution yields climb back toward their 16.8%-19.6% decade averages, DPI is the number that tells you what a fund has actually done, not what it hopes to do. Track your own fund's numbers against these benchmarks on Value Add VC.
Latest from the Pulse
Get VC data most people never see
— free to subscribe
Trace's notes on venture, AI and startups, a few times a week. Join 5,000+ subscribers. No spam.